AWS DevOps Best Practices: CI/CD Pipelines, Terraform & Deployment Automation in 2026
A practical guide to building DevOps on AWS - the CI/CD pipeline architecture that eliminates deployment risk, how Terraform manages AWS infrastructure at scale, deployment strategies that achieve zero downtime, and the DORA metrics that tell you whether your DevOps is actually working.

- What this guide covers: The complete AWS DevOps stack - CI/CD pipeline design, infrastructure as code with Terraform, deployment strategies (blue-green, canary), observability, and the security practices that belong in every pipeline.
- Who it's for: Engineering leads, CTOs, and developers at startups and SMBs who are deploying manually, using incomplete pipelines, or looking to dramatically increase deployment frequency and reliability.
- The core insight: DevOps maturity is measurable. DORA metrics (deployment frequency, lead time, change failure rate, MTTR) give you a before/after picture. High-performing teams deploy 208× more frequently than low performers - not because they have more people, but because their pipeline is right.
1. Why DevOps Maturity Is a Business Problem, Not a Technical One
Every week that an engineering team cannot deploy safely is a week where customer feedback loops are broken, bug fixes accumulate, and feature velocity lags competitors. Manual deployments that require a senior engineer's attention on a Friday afternoon are not a workflow preference - they are a business risk.
The DORA Research Program (DevOps Research and Assessment, now part of Google Cloud) has measured software delivery performance across thousands of organizations for over a decade. The data is consistent: high-performing DevOps teams deliver significantly more value with significantly less risk than low-performing teams.
| DORA Metric | Elite vs. Low Performance & Business Implication |
|---|---|
| Deployment frequency | Elite: multiple deploys per day. Low: monthly or less. Implication: slow deployment frequency means slow customer feedback, slower bug resolution, and larger, riskier releases. |
| Lead time for changes | Elite: under 1 hour from commit to production. Low: 1 month to 6 months. Implication: long lead times mean customer needs change before features ship. |
| Change failure rate | Elite: 0-5% of deployments cause incidents. Low: 46-60%. Implication: high failure rates mean deployment is feared, slowing frequency further - a vicious cycle. |
| Time to restore service | Elite: under 1 hour. Low: 1 week to 1 month. Implication: slow recovery means prolonged customer impact from every incident. |
The pattern: High-performing teams deploy more frequently, with lower failure rates, and recover faster when something does fail. This is not a coincidence - it is the result of the specific practices this guide covers.
2. DevOps Maturity: Where Does Your Team Stand?
Before designing the target state, assess your current state honestly. Teams tend to overestimate their DevOps maturity by focusing on the tools they have rather than the practices those tools enable.
| Step | Actions |
|---|---|
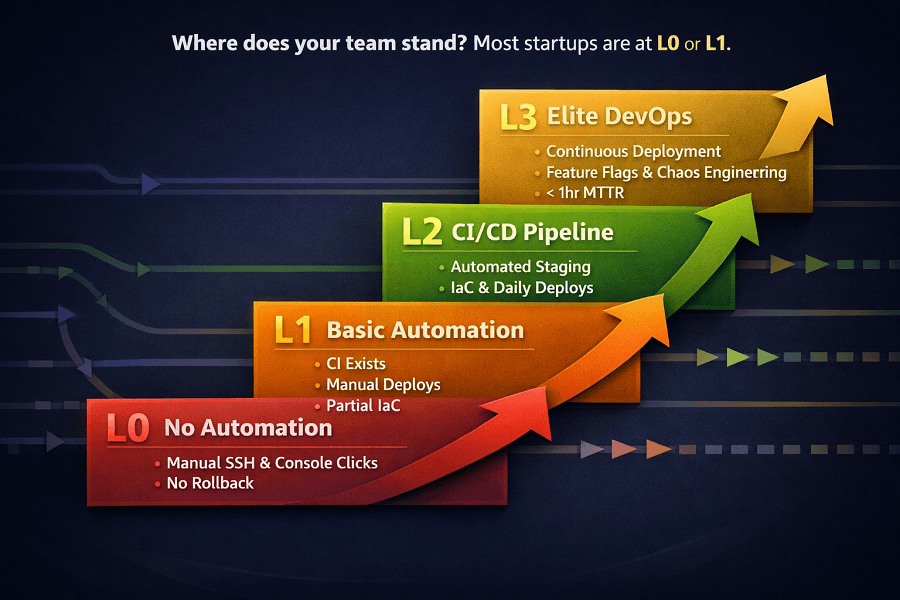
| L0 (No Automation) | - Deployments are manual: SSH into servers, run scripts, hope nothing breaks - Infrastructure is configured manually through consoles - undocumented, unreproducible - Testing is manual or nearly absent; deploying requires developer courage, not confidence - No rollback procedure. Recovery means reverting by hand under pressure - Deployment frequency: monthly or quarterly. Change failure rate: high and uncounted |
| L1 (Basic Automation) | - CI pipeline exists: tests run automatically on pull requests - Deployment script exists but is run manually by a developer or ops engineer - Infrastructure may be partially documented but is not in version control - Rollback is possible but requires manual steps and is rarely tested - Deployment frequency: weekly or bi-weekly. Deployments still cause anxiety |
| L2 (CI/CD Pipeline) | - Full CI/CD: merge to main triggers automated build, test, and deploy to staging - Production deployment is automated but may require a manual approval gate - Infrastructure is in code (Terraform or CloudFormation) and version-controlled - Rollback is automated or semi-automated via pipeline - Deployment frequency: daily to multiple times per week. Low-risk releases |
| L3 (Elite DevOps) | - Continuous deployment: every commit that passes tests ships to production automatically - Feature flags decouple deploy from release - dark launches, gradual rollouts - Full observability: SLOs defined, error budgets tracked, deployment impact visible in dashboards - Chaos engineering: failure modes tested proactively, not discovered in production - Deployment frequency: 10+ per day. Change failure rate under 5%. MTTR under 1 hour |
3. The Production-Grade CI/CD Pipeline: Stage by Stage
A complete CI/CD pipeline is not a deployment script. It is a quality gate system - every stage filters out defects before they can reach production. Each stage has a specific purpose, and skipping stages is how deployment failure rates climb.
| Step & Time | Actions |
|---|---|
1 Source & PR Checks < 2 min |
- Developer opens a pull request; pipeline triggers immediately on every commit to the PR - Static analysis: linting, formatting checks, unused import detection - fail fast on code style - Secret scanning: detect accidental API keys, tokens, or credentials committed to the repo (use Trufflehog, GitLeaks, or GitHub Advanced Security) - Dependency vulnerability scan: check npm/pip/Maven dependencies against known CVE databases - Infrastructure cost estimation: Infracost calculates projected monthly cost change from Terraform modifications - visible on the PR before merge |
2 Build & Unit Test 2-8 min |
- Docker image build: multi-stage build (build stage + minimal runtime stage) to minimize image size - Unit tests: fast, isolated tests that run against the application code without external dependencies - Code coverage check: enforce minimum coverage threshold (e.g. 70%); fail if coverage drops - Image vulnerability scan: scan the built Docker image with Amazon ECR image scanning or Trivy - block images with Critical CVEs - Push image to Amazon ECR with Git commit SHA tag (never 'latest' - enables precise rollback) |
3 Integration Tests - Staging 5-20 min |
- Deploy to staging environment automatically after successful build - Integration tests: test service interactions, database queries, third-party API integrations - End-to-end tests: simulate real user flows through the application - critical paths only - Performance regression: compare API response times against a baseline; fail if P95 degrades > 20% - Staging should mirror production configuration as closely as possible - divergence causes production surprises |
4 Security Scanning 3-10 min |
- SAST (Static Application Security Testing): scan application code for security vulnerabilities - DAST (Dynamic Application Security Testing) on staging: probe running application for injection vulnerabilities, misconfigured headers, exposed endpoints - Infrastructure security scan: run Checkov or tfsec against Terraform code to detect insecure configurations before they deploy - Compliance checks: verify SOC 2 / HIPAA controls remain in place (AWS Config rules, Security Hub standards) |
5 Production Deployment 5-15 min |
- Blue-green or canary deployment strategy (see Section 5) - never direct replace in production - Database migrations: run automatically before application deployment; confirm success before routing traffic - Health check validation: confirm new deployment passes health checks at each traffic level before proceeding - Automated rollback trigger: if error rate or latency exceeds threshold within 10 minutes of deploy, rollback automatically - Deployment notification: Slack/Teams notification with deploy details, duration, and link to monitoring dashboard |
6 Post-Deploy Validation 5-10 min ongoing |
- Smoke tests against production: verify critical user flows work in the real environment - Monitor error rate and latency for 10 minutes post-deploy; alarm on anomaly - Compare key business metrics (conversion rate, API success rate) against pre-deploy baseline - Tag deployed commit in version control with production deployment timestamp - Update deployment tracking (JIRA, Linear, or custom) with production release status |
4. Infrastructure as Code with Terraform on AWS
Infrastructure as Code (IaC) is the practice of defining and managing cloud infrastructure through code - version-controlled, peer-reviewed, and reproducible. On AWS, Terraform is the most widely adopted IaC tool, used by EaseCloud on every engagement.
The alternative - clicking through the AWS console to configure resources - produces environments that are undocumented, unreproducible, and impossible to audit. Any engineer who has tried to rebuild a manually configured environment from scratch, or figure out why two environments are behaving differently, understands why IaC is non-negotiable.
Why Terraform over AWS CloudFormation
| Factor | Terraform vs. CloudFormation |
|---|---|
| Multi-cloud support | Terraform manages resources across AWS, Azure, GCP, and 1,000+ providers. CloudFormation is AWS-only. If you have any non-AWS resources (Cloudflare DNS, GitHub repos, Datadog monitors), Terraform manages them in the same codebase. |
| HCL vs. JSON/YAML | Terraform's HashiCorp Configuration Language (HCL) is more readable and writable than CloudFormation's JSON or YAML. Variables, functions, loops, and conditionals are first-class in HCL. CloudFormation requires workarounds for equivalent flexibility. |
| Plan before apply | 'terraform plan' shows exactly what changes will be made before making them - a dry run with human-readable output. CloudFormation change sets provide similar but less intuitive output. |
| State management | Terraform maintains explicit state in a state file (stored in S3 with DynamoDB locking for teams). This makes resource tracking explicit and auditable. CloudFormation manages state internally - less visible. |
| Ecosystem | Terraform Registry has thousands of community modules for AWS services. Reuse is straightforward. CloudFormation's module ecosystem is more limited. |
| EaseCloud's choice | EaseCloud uses Terraform for all infrastructure delivery. All clients receive Terraform code they own, can modify, and can run independently of EaseCloud. |
Terraform best practices on AWS
- Remote state in S3 with DynamoDB locking: never use local state in a team environment. S3 backend with versioning enabled; DynamoDB table for state locking prevents concurrent apply conflicts.
- Workspaces or separate directories for environments: dev, staging, and prod should be separate Terraform workspaces or directories - never the same state file. A mistake in dev should not affect prod.
- Terraform modules for reusability: wrap common patterns (a VPC module, an ECS service module, an RDS module) into modules with documented inputs and outputs. Reuse across environments.
- Variables and tfvars files for environment differences: never hardcode environment-specific values. Use variables with .tfvars files per environment - committed to version control for auditability.
- Terraform plan in CI/CD: run terraform plan on every pull request; post the plan output as a PR comment. Engineers reviewing infrastructure changes see exactly what will happen before approving.
- Terraform apply via CI/CD only: never allow engineers to run terraform apply from their local machines against production. All production infrastructure changes flow through the pipeline and are logged.
- Drift detection: run terraform plan on a schedule (daily) and alert when actual infrastructure diverges from the state file - someone made a manual console change that bypassed IaC.
5. Deployment Strategies: How to Ship to Production Without Fear
The deployment strategy determines what happens to your users during a release. The wrong strategy turns every deployment into a potential outage. The right strategy makes deployments invisible to customers and instantly reversible if something goes wrong.
Blue-Green Deployment
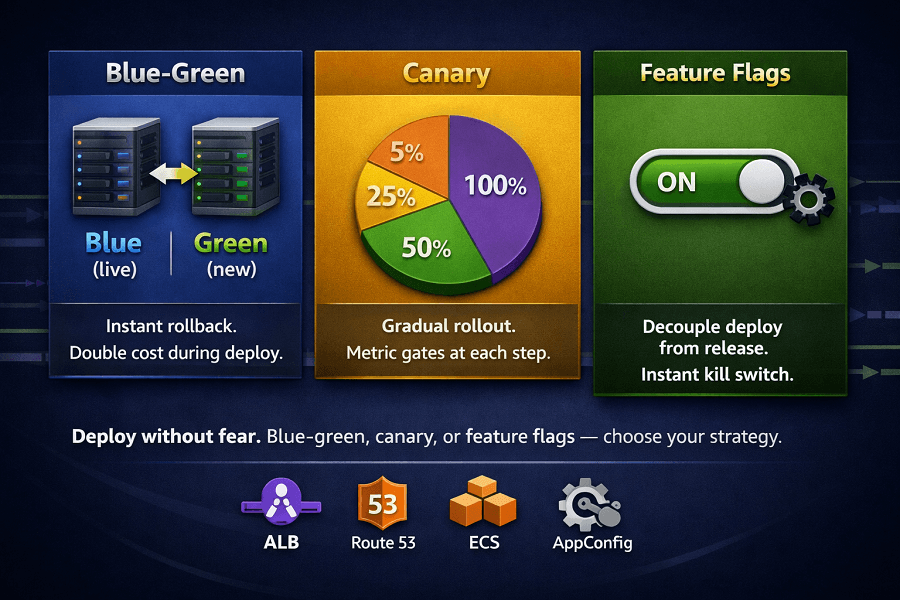
Blue-green maintains two identical production environments: blue (current live) and green (new version). When green is validated, traffic switches from blue to green in a single operation. Rollback is switching back to blue - instantaneous.
- On AWS ECS: use a second ECS service target group; ALB listener rule shifts traffic to the green target group at cutover
- On AWS EKS: use two Kubernetes Deployments with a Service selector swap; or use ALB Ingress controller with weighted target groups
- Database consideration: blue-green requires that both application versions are compatible with the same database schema - run additive-only migrations before cutover
- Cost: blue-green doubles compute cost during deployment window - typically 15-30 minutes
- Best for: applications where instant rollback is critical and the deployment window cost is acceptable
Canary Deployment
Canary releases shift a small percentage of traffic (5-10%) to the new version, monitor error rates and latency, and gradually increase to 100% if all metrics are healthy. Catches production issues while limiting blast radius.
- On AWS: Application Load Balancer weighted target groups; or Route 53 weighted routing; or AWS CodeDeploy canary deployment configuration
- Progressive traffic shift: 5% → 25% → 50% → 100%, with automated health checks at each level
- Automated rollback: if error rate exceeds threshold at any traffic level, automatically roll back to 0% new version
- Best for: high-traffic applications, user-facing changes with uncertain impact, teams that want gradual confidence before full rollout
Rolling Deployment
Rolling deployments replace instances of the old version one at a time (or in small batches), with health checks between each replacement. Lower resource cost than blue-green; slower rollback than blue-green.
- On AWS ECS: set minimum healthy percent to 50-100% and maximum percent to 150-200% in the ECS service deployment configuration
- On AWS EKS: Kubernetes Deployment rolling update strategy with maxUnavailable and maxSurge configuration
- Rollback: requires re-deploying the previous image version - takes as long as the initial deployment
- Best for: stateless services where brief mixed-version operation is acceptable and cost of blue-green is not justified
Feature Flags: Decoupling Deploy from Release
Feature flags are toggles in application code that enable or disable functionality independently of deployment. This decouples the act of deploying code from the act of releasing features to users.
- AWS AppConfig: managed feature flag and configuration service. Deploys flag changes without application redeployment. Supports gradual rollout, A/B testing, and instant kill switch
- LaunchDarkly / Flagsmith: third-party feature flag platforms with richer targeting (user properties, segments, percentage rollouts)
- Use cases: dark launches (deploy code that's off until ready), percentage rollouts (enable for 5% of users), instant kill switch (disable a broken feature without redeployment), A/B testing
6. CI/CD Tool Selection: GitHub Actions, AWS CodePipeline, or GitLab CI?
The right CI/CD tool depends on where your code lives, your team's existing expertise, and how deeply you need AWS service integration. Here is an honest assessment of the main options.
| Tool | Best For | EaseCloud's Assessment |
|---|---|---|
| GitHub Actions | Best overall for most startups | Native to GitHub (where most startups host code). Huge marketplace of pre-built actions for AWS deployment, Docker, testing, and security scanning. Free tier generous. AWS provides official actions (ECR push, ECS deploy, Lambda deploy). Easiest to get to production quickly. |
| GitLab CI/CD | Best for GitLab-hosted teams | If your code is on GitLab, GitLab CI is the natural choice. Strong built-in Docker support, good AWS integration via official GitLab-AWS runners. More opinionated than GitHub Actions but very capable for production pipelines. |
| AWS CodePipeline | Best for AWS-native, no GitHub | Fully managed by AWS; integrates natively with CodeBuild, CodeDeploy, ECR, ECS, and Lambda. No external dependencies. More verbose to configure than GitHub Actions. Good choice when you want everything inside the AWS console and AWS IAM controls. |
| CircleCI | Good for complex, parallel builds | Strong performance optimization features (test parallelization, orbs for reuse). Slightly steeper learning curve than GitHub Actions. Less commonly used at startup scale in 2026 - GitHub Actions has absorbed most of its market. |
| Jenkins | Avoid for greenfield in 2026 | Self-hosted; maximum flexibility but maximum maintenance overhead. Running Jenkins on EC2 requires OS patching, plugin management, and scaling your own build infrastructure. Not appropriate for startups without dedicated DevOps engineers. |
7. Security in CI/CD: Shift-Left Security on AWS
'Shift left' security means moving security checks earlier in the development process - to the pull request and build stages rather than at deployment time or after an incident. Security defects found in a PR cost minutes to fix; found in production they can cost weeks and significant reputation damage.
| Security Check | Pipeline Stage | Implementation |
|---|---|---|
| Secret scanning | Every commit, every PR | Trufflehog, GitLeaks, or GitHub Advanced Security scans every commit for accidentally committed API keys, tokens, database credentials, and private keys. Block the PR if secrets are detected. Never allow secrets to reach version history - they persist even after deletion. |
| Dependency vulnerability scanning | Build stage | npm audit, pip-audit, Dependabot, or Snyk checks all third-party dependencies against CVE databases. Alert on HIGH/CRITICAL CVEs; block deployment on CRITICAL. Set up automated PRs for security updates. |
| Container image scanning | After image build | Amazon ECR image scanning (powered by Snyk) or Trivy scans the built Docker image for OS package vulnerabilities. Block deployment of images with Critical CVEs. Scan on every build - not just periodically. |
| IaC security scanning | On Terraform PRs | Checkov or tfsec scans Terraform code for security misconfigurations: public S3 buckets, unencrypted RDS instances, overly permissive security groups, missing encryption. Visible in the PR before merge. |
| SAST | Build stage | SonarQube, CodeQL (GitHub), or Semgrep scans application code for security vulnerabilities: SQL injection, XSS, path traversal, insecure deserialization. Integrates with pull requests; findings appear as PR comments. |
| Least-privilege IAM for pipeline | Pipeline configuration | The CI/CD pipeline's AWS IAM role should have only the permissions needed for that specific pipeline - not AdministratorAccess. Separate IAM roles per pipeline stage; review and audit quarterly. |
8. Observability: Knowing When a Deployment Goes Wrong
A deployment pipeline that can detect and roll back a bad release automatically is significantly safer than one that requires a human to notice something is wrong, find the issue, and manually revert. Automated post-deployment observability is what makes continuous deployment safe.
The three metrics every deployment should monitor
- Error rate: percentage of requests returning 5xx responses. Baseline before deploy; alert if error rate rises above threshold (e.g. > 1%) within 10 minutes of deployment.
- Latency (P95/P99): measure 95th and 99th percentile response times. Latency regression is often a canary for performance problems that affect a subset of users.
- Business metrics: order conversion rate, API success rate, user signup rate. Infrastructure metrics can be healthy while a business logic bug silently breaks user flows. Track both.
Deployment tracking in CloudWatch
- Create a CloudWatch dashboard that shows error rate, latency, and business metrics with a vertical annotation line at every deployment timestamp
- Deploy annotations via the AWS CLI in the post-deploy pipeline step: aws cloudwatch put-dashboard annotated with the deployment version
- Set CloudWatch Alarms on the post-deploy metrics with actions to trigger an SNS topic - which can call a Lambda that invokes an automated rollback
Automated rollback
An automated rollback triggered by post-deploy metric anomaly is the highest-value safety net in a CI/CD pipeline. Implementation on AWS ECS:
- Deploy new task definition version to ECS service
- CloudWatch Alarm monitors error rate for 10 minutes post-deploy
- If alarm triggers: ECS CodeDeploy deployment configuration automatically rolls back to the previous task definition
- Slack/Teams notification sent with rollback details and link to the failing metric
This entire cycle - deploy, detect failure, rollback - can complete in under 15 minutes with zero human intervention.
9. The AWS DevOps Implementation Checklist
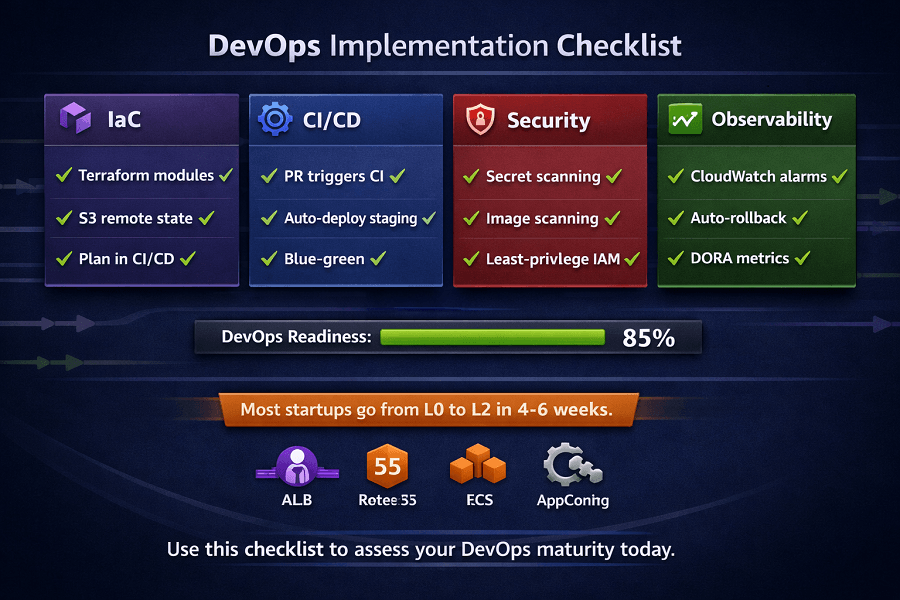
Use this checklist to assess your current DevOps maturity and identify the highest-priority gaps to address.
Infrastructure as Code
- All AWS infrastructure defined in Terraform or CloudFormation - zero manual console configurations
- Terraform state stored in S3 with DynamoDB locking
- Separate Terraform state per environment (dev / staging / prod)
- terraform plan runs on every infrastructure PR and output posted as comment
- Infracost integrated - cost impact visible on every infrastructure PR
CI/CD Pipeline
- CI triggers on every pull request - no manual test runs
- Unit tests run in CI and block merge on failure
- Docker images built and tagged with Git commit SHA
- Images pushed to Amazon ECR with vulnerability scan enabled
- Automated deployment to staging on merge to main
- Integration and E2E tests run against staging before production deploy
- Production deployment uses blue-green or canary strategy - no direct replace
Security in Pipeline
- Secret scanning on every commit (Trufflehog or GitHub Advanced Security)
- Dependency vulnerability scanning in CI (npm audit, pip-audit, Snyk)
- Container image scanning before every deployment (ECR or Trivy)
- IaC security scanning on Terraform PRs (Checkov or tfsec)
- CI/CD pipeline IAM role uses least-privilege permissions
Observability & Rollback
- CloudWatch alarms on error rate and latency - active from day one
- Deployment annotations on CloudWatch dashboards
- Automated rollback configured for production deployments
- Slack/Teams deployment notifications for all production releases
- DORA metrics tracked: deployment frequency, lead time, change failure rate, MTTR
Conclusion
Production-grade DevOps on AWS is not about choosing the right tools – it is about building the right pipeline. A complete CI/CD pipeline with automated testing, security scanning, blue-green or canary deployment, and automated rollback transforms deployment from a high-risk event into a routine, low-risk operation. The DORA metrics tell the story: high-performing teams deploy 208× more frequently with <5% failure rates.
The path is clear: infrastructure in code (Terraform), automated pipeline (GitHub Actions or CodePipeline), deployment strategies that eliminate downtime (blue-green/canary), and observability that catches regressions instantly. Most startups go from manual deployments to automated production pipelines in 4-6 weeks. The investment pays back in every deployment after that.
AWS DevOps FAQ
How long does it take to build a production-grade CI/CD pipeline on AWS?
A complete CI/CD pipeline - from PR checks through automated production deployment with blue-green strategy, security scanning, and automated rollback - takes 4-8 weeks with a dedicated DevOps engineer or a consulting engagement. The first working pipeline (CI + deploy to staging) can be operational in 1-2 weeks. The additional stages (security scanning, canary deployment, automated rollback, observability integration) are layered in over the following weeks.
Should we use GitHub Actions or AWS CodePipeline?
If your code is on GitHub: GitHub Actions. It has first-class AWS support, a massive ecosystem of pre-built actions, and the lowest barrier to a production pipeline. AWS CodePipeline makes sense when you need everything within AWS IAM governance, when your team prefers AWS-native tooling, or when you are not using a third-party Git host. Both are production-grade - the choice is mostly about where your team's expertise already sits.
Do we need Terraform if we're a small team?
Yes - for any environment you plan to operate for more than a few weeks. The cost of learning Terraform is approximately one week. The cost of not using Terraform is months of undocumented, irreproducible infrastructure that becomes increasingly painful to manage as the team grows. Start with Terraform from day one, even for a small environment. The most expensive Terraform projects EaseCloud has inherited are the ones that started without it.
How do we handle database migrations in a CI/CD pipeline?
Database migrations should run automatically as part of the deployment pipeline, before the new application version receives traffic. Tools: Flyway (Java, any DB), Alembic (Python/SQLAlchemy), ActiveRecord migrations (Rails), Prisma migrate (Node.js). Key principles: migrations must be additive and backward-compatible during the deployment window - add columns before removing them; the old application version must work with the new schema during rollout. Test migrations in staging with a production-representative data volume before production.
What is the difference between continuous integration and continuous deployment?
Continuous Integration (CI): every code change is automatically built, tested, and integrated - no long-lived feature branches sitting unmerged. Continuous Delivery (CD): every change that passes CI is deployable to production - deployment is a one-click decision. Continuous Deployment: every change that passes CI is automatically deployed to production without human approval. Most startups should target Continuous Delivery (automated up to a prod approval gate) and evolve toward Continuous Deployment as test coverage and deployment confidence increase.
Ready to Build Production-Grade DevOps on AWS?
EaseCloud builds complete CI/CD pipelines, Terraform infrastructure, and observability stacks on AWS - all delivered as code your team owns from day one. Most clients go from manual deployments to automated production pipelines in 4-6 weeks. Identify the highest-risk gaps and the fastest path to L2 DevOps maturity
Book Your Free Assessment