Track Production LLM Metrics with CloudWatch
Monitor production LLMs on AWS with CloudWatch to track latency, errors, and GPU health, build dashboards, set alerts, analyze logs, and use X-Ray tracing to detect issues early and maintain reliable, SLA-compliant inference at scale.
TLDR;
- Track P50, P95, P99 latency and error rates with automatic SageMaker metric collection
- Custom GPU metrics monitor utilization, memory, temperature, and power draw
- Configure alarms at 80% of SLA thresholds for proactive warning before user impact
- X-Ray distributed tracing pinpoints bottlenecks across tokenization, inference, and post-processing
Monitor LLM deployments with CloudWatch for reliability and performance. This guide shows you how to track metrics, set up alerts, and debug issues in production.
Production LLMs fail in subtle ways that only comprehensive monitoring can detect. Latency gradually increases, error rates spike unexpectedly, and GPU memory leaks develop slowly over time. Without proper monitoring infrastructure, you discover these issues when users complain rather than through proactive alerts.
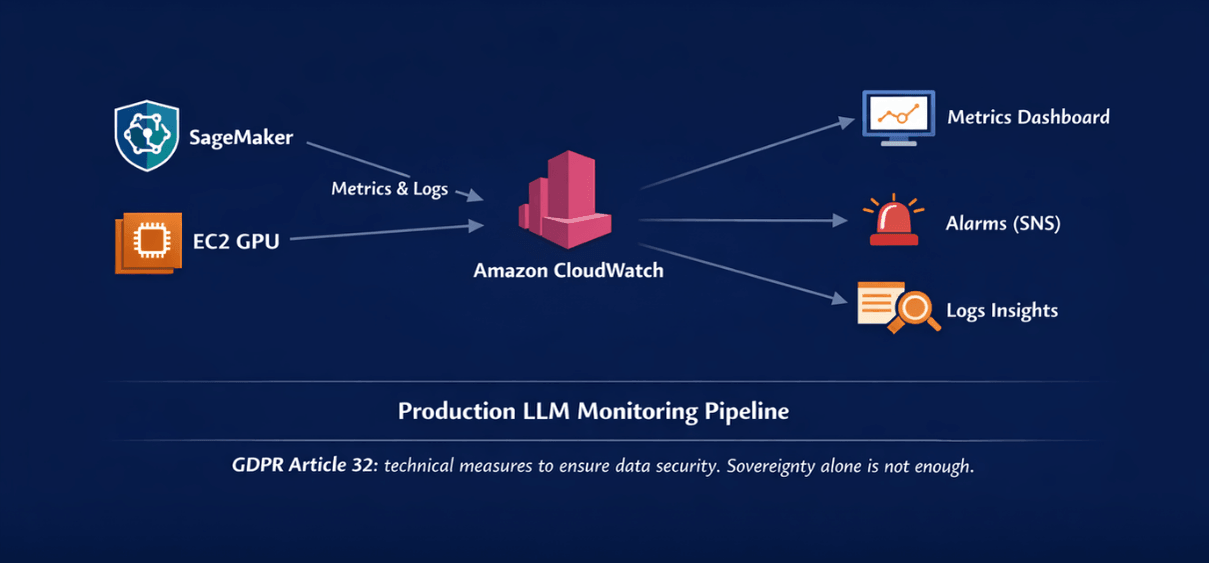
This guide provides complete CloudWatch monitoring setup for AWS LLM deployments, covering automatic metric collection from SageMaker and EC2, custom application metrics for business-specific tracking, and automated alerting through SNS.
| Capability | Purpose |
|---|---|
| Automatic metric collection | From SageMaker/EC2 |
| Custom metrics | Application-specific tracking |
| Automated alerting | Via SNS |
| X-Ray integration | Distributed tracing |
| Log aggregation | Centralized debugging |
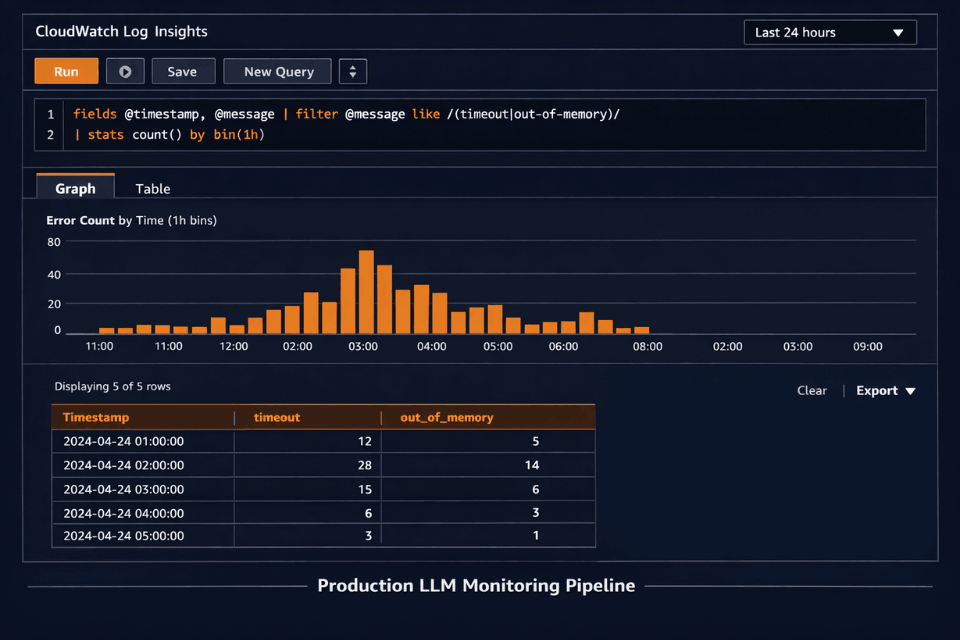
| Log Insights | Pattern detection |
| Dashboards | Visualization |
You'll learn how to create production dashboards visualizing performance across all endpoints, configure alarms for high latency and error rates, aggregate logs from distributed systems, and use X-Ray for distributed tracing.
Implementation includes GPU monitoring with custom metrics, Log Insights queries for pattern detection, and cost optimization strategies to minimize monitoring expenses.
Whether you're running SageMaker endpoints, EC2 GPU instances, or ECS containers, this tutorial delivers production-tested monitoring patterns ensuring reliability, performance visibility, and SLA compliance for enterprise LLM deployments.
CloudWatch Capabilities
Key features:
- Automatic metric collection from SageMaker/EC2
- Custom metrics for application-specific tracking
- Automated alerting via SNS
- Integration with X-Ray for distributed tracing
- Log aggregation and analysis
- Dashboards for visualization
Essential Metrics to Track
Monitor these metrics for healthy LLM deployments.
SageMaker Endpoint Metrics
Automatically collected:
Model Latency:
- ModelSetupTime: Time to load model
- ModelLatency: Inference duration
- OverheadLatency: Pre/post-processing time
Invocations:
- Invocations: Total requests
- InvocationsPerInstance: Load distribution
- ModelInvocationErrors: Failed requests
Instance Metrics:
- CPUUtilization: CPU usage percentage
- MemoryUtilization: Memory usage percentage
- DiskUtilization: Storage usage
Custom Application Metrics
Track business-specific metrics:
import boto3
from datetime import datetime

cloudwatch = boto3.client('cloudwatch')

def publish_custom_metrics(
    tokens_generated,
    prompt_length,
    response_quality_score
):
    cloudwatch.put_metric_data(
        Namespace='LLM/Production',
        MetricData=[
            {
                'MetricName': 'TokensGenerated',
                'Value': tokens_generated,
                'Unit': 'Count',
                'Timestamp': datetime.utcnow(),
                'Dimensions': [
                    {'Name': 'Model', 'Value': 'llama-70b'},
                    {'Name': 'Environment', 'Value': 'production'}
                ]
            },
            {
                'MetricName': 'PromptLength',
                'Value': prompt_length,
                'Unit': 'Count',
                'StorageResolution': 1  # High-resolution (1-second)
            },
            {
                'MetricName': 'QualityScore',
                'Value': response_quality_score,
                'Unit': 'None',
                'StatisticValues': {
                    'SampleCount': 1,
                    'Sum': response_quality_score,
                    'Minimum': response_quality_score,
                    'Maximum': response_quality_score
                }
            }
        ]
    )
GPU Metrics (EC2)
Monitor GPU utilization:
import subprocess
import boto3

def collect_gpu_metrics():
    result = subprocess.run([
        'nvidia-smi',
        '--query-gpu=utilization.gpu,memory.used,temperature.gpu,power.draw',
        '--format=csv,noheader,nounits'
    ], capture_output=True, text=True)

    cloudwatch = boto3.client('cloudwatch')

    for idx, line in enumerate(result.stdout.strip().split('\n')):
        gpu_util, mem_used, temp, power = map(float, line.split(', '))

        cloudwatch.put_metric_data(
            Namespace='GPU/Metrics',
            MetricData=[
                {
                    'MetricName': 'GPUUtilization',
                    'Value': gpu_util,
                    'Unit': 'Percent',
                    'Dimensions': [
                        {'Name': 'InstanceId', 'Value': instance_id},
                        {'Name': 'GPUIndex', 'Value': str(idx)}
                    ]
                },
                {
                    'MetricName': 'GPUMemoryUsed',
                    'Value': mem_used,
                    'Unit': 'Megabytes'
                },
                {
                    'MetricName': 'GPUTemperature',
                    'Value': temp,
                    'Unit': 'None'
                },
                {
                    'MetricName': 'PowerDraw',
                    'Value': power,
                    'Unit': 'None'
                }
            ]
        )

# Run every 60 seconds
import schedule
schedule.every(60).seconds.do(collect_gpu_metrics)
Creating Dashboards
Visualize metrics for quick insights.
Production Dashboard
import boto3
import json

cloudwatch = boto3.client('cloudwatch')

dashboard_config = {
    "widgets": [
        {
            "type": "metric",
            "x": 0,
            "y": 0,
            "width": 12,
            "height": 6,
            "properties": {
                "metrics": [
                    ["AWS/SageMaker", "ModelLatency", {"stat": "Average"}],
                    ["...", {"stat": "p95"}],
                    ["...", {"stat": "p99"}]
                ],
                "period": 300,
                "stat": "Average",
                "region": "us-east-1",
                "title": "Model Latency (ms)",
                "yAxis": {
                    "left": {"min": 0}
                }
            }
        },
        {
            "type": "metric",
            "x": 12,
            "y": 0,
            "width": 12,
            "height": 6,
            "properties": {
                "metrics": [
                    ["AWS/SageMaker", "Invocations", {"stat": "Sum"}],
                    [".", "ModelInvocationErrors", {"stat": "Sum"}]
                ],
                "period": 300,
                "stat": "Sum",
                "region": "us-east-1",
                "title": "Requests & Errors"
            }
        },
        {
            "type": "metric",
            "x": 0,
            "y": 6,
            "width": 24,
            "height": 6,
            "properties": {
                "metrics": [
                    ["GPU/Metrics", "GPUUtilization", {"stat": "Average"}],
                    [".", "GPUMemoryUsed", {"yAxis": "right"}]
                ],
                "period": 60,
                "stat": "Average",
                "region": "us-east-1",
                "title": "GPU Utilization",
                "yAxis": {
                    "left": {"label": "Utilization %", "min": 0, "max": 100},
                    "right": {"label": "Memory MB"}
                }
            }
        }
    ]
}

cloudwatch.put_dashboard(
    DashboardName='LLMProduction',
    DashboardBody=json.dumps(dashboard_config)
)
Setting Up Alerts
Automated alerts prevent outages.
High Latency Alert
cloudwatch.put_metric_alarm(
    AlarmName='LLM-High-Latency',
    ComparisonOperator='GreaterThanThreshold',
    EvaluationPeriods=2,
    MetricName='ModelLatency',
    Namespace='AWS/SageMaker',
    Period=300,  # 5 minutes
    Statistic='Average',
    Threshold=1000.0,  # 1 second
    ActionsEnabled=True,
    AlarmActions=[
        'arn:aws:sns:us-east-1:account:ops-alerts'
    ],
    AlarmDescription='Alert when model latency exceeds 1 second',
    Dimensions=[
        {'Name': 'EndpointName', 'Value': 'llama-endpoint'},
        {'Name': 'VariantName', 'Value': 'AllTraffic'}
    ],
    TreatMissingData='notBreaching'
)
Error Rate Alert
cloudwatch.put_metric_alarm(
    AlarmName='LLM-High-Error-Rate',
    ComparisonOperator='GreaterThanThreshold',
    EvaluationPeriods=1,
    Metrics=[
        {
            'Id': 'error_rate',
            'Expression': '(errors / invocations) * 100',
            'Label': 'Error Rate %'
        },
        {
            'Id': 'errors',
            'MetricStat': {
                'Metric': {
                    'Namespace': 'AWS/SageMaker',
                    'MetricName': 'ModelInvocationErrors',
                    'Dimensions': [
                        {'Name': 'EndpointName', 'Value': 'llama-endpoint'}
                    ]
                },
                'Period': 300,
                'Stat': 'Sum'
            },
            'ReturnData': False
        },
        {
            'Id': 'invocations',
            'MetricStat': {
                'Metric': {
                    'Namespace': 'AWS/SageMaker',
                    'MetricName': 'Invocations',
                    'Dimensions': [
                        {'Name': 'EndpointName', 'Value': 'llama-endpoint'}
                    ]
                },
                'Period': 300,
                'Stat': 'Sum'
            },
            'ReturnData': False
        }
    ],
    Threshold=5.0,  # 5% error rate
    AlarmActions=['arn:aws:sns:us-east-1:account:critical-alerts']
)
GPU Temperature Alert
cloudwatch.put_metric_alarm(
    AlarmName='GPU-High-Temperature',
    ComparisonOperator='GreaterThanThreshold',
    EvaluationPeriods=3,
    MetricName='GPUTemperature',
    Namespace='GPU/Metrics',
    Period=60,
    Statistic='Average',
    Threshold=80.0,  # 80°C
    ActionsEnabled=True,
    AlarmActions=['arn:aws:sns:us-east-1:account:hardware-alerts'],
    AlarmDescription='Alert when GPU temperature exceeds 80°C'
)
Log Aggregation and Analysis
Centralize logs for debugging.
CloudWatch Logs Integration
import logging
import boto3
from watchtower import CloudWatchLogHandler

# Configure CloudWatch Logs handler
cloudwatch_handler = CloudWatchLogHandler(
    log_group='/aws/llm/production',
    stream_name='inference-server',
    send_interval=10,  # Send every 10 seconds
    create_log_group=True
)

# Setup logging
logger = logging.getLogger('llm-inference')
logger.addHandler(cloudwatch_handler)
logger.setLevel(logging.INFO)

# Log inference requests
def log_inference(prompt, response, latency):
    logger.info('Inference completed', extra={
        'prompt_length': len(prompt),
        'response_length': len(response),
        'latency_ms': latency,
        'timestamp': datetime.utcnow().isoformat()
    })
Log Insights Queries
Find patterns in logs:
-- Find slowest requests
fields @timestamp, latency_ms, prompt_length
| filter latency_ms > 1000
| sort latency_ms desc
| limit 20

-- Error analysis
fields @timestamp, @message
| filter @message like /error|exception/
| stats count() by bin(5m)

-- Token usage analysis
fields @timestamp, prompt_length, response_length
| stats avg(prompt_length), avg(response_length), sum(response_length) by bin(1h)
Automated Log Analysis
Create insights from logs:
logs = boto3.client('logs')

# Query logs
response = logs.start_query(
    logGroupName='/aws/llm/production',
    startTime=int((datetime.now() - timedelta(hours=1)).timestamp()),
    endTime=int(datetime.now().timestamp()),
    queryString='''
        fields @timestamp, latency_ms
        | filter latency_ms > 500
        | stats count() as slow_requests, avg(latency_ms) as avg_latency
    '''
)

query_id = response['queryId']

# Wait for results
import time
while True:
    result = logs.get_query_results(queryId=query_id)
    if result['status'] == 'Complete':
        print(result['results'])
        break
    time.sleep(1)
Log Insights queries find slow requests, error patterns, and token trends. We write them for you.
The post shows sample queries. Production troubleshooting requires queries specific to your logging format and error patterns.
We help you:
- Find slowest requests – Query for latency > threshold with prompts
- Analyze error patterns – Group errors by type, model version, input size
- Track token usage trends – Average prompt length, response length over time
- Correlate with CloudWatch alarms – Triggered queries during incidents
X-Ray Distributed Tracing
Debug complex request flows.
Enable X-Ray Tracing
from aws_xray_sdk.core import xray_recorder
from aws_xray_sdk.ext.flask.middleware import XRayMiddleware

app = Flask(__name__)
XRayMiddleware(app, xray_recorder)

@app.route('/generate')
@xray_recorder.capture('generate_text')
def generate():
    # Trace subsegments
    with xray_recorder.in_subsegment('tokenize') as subsegment:
        tokens = tokenizer(prompt)
        subsegment.put_metadata('token_count', len(tokens))

    with xray_recorder.in_subsegment('inference') as subsegment:
        output = model.generate(tokens)
        subsegment.put_annotation('model', 'llama-70b')

    return output
Conclusion
CloudWatch monitoring provides comprehensive visibility into production LLM deployments, enabling proactive issue detection before users experience problems. Automated metric collection from SageMaker and EC2 combined with custom application metrics delivers complete performance tracking.
Configured alarms for latency, error rates, and GPU utilization ensure immediate notification of anomalies. CloudWatch Logs aggregation centralizes debugging information, while Log Insights queries reveal patterns in request failures and performance degradation.
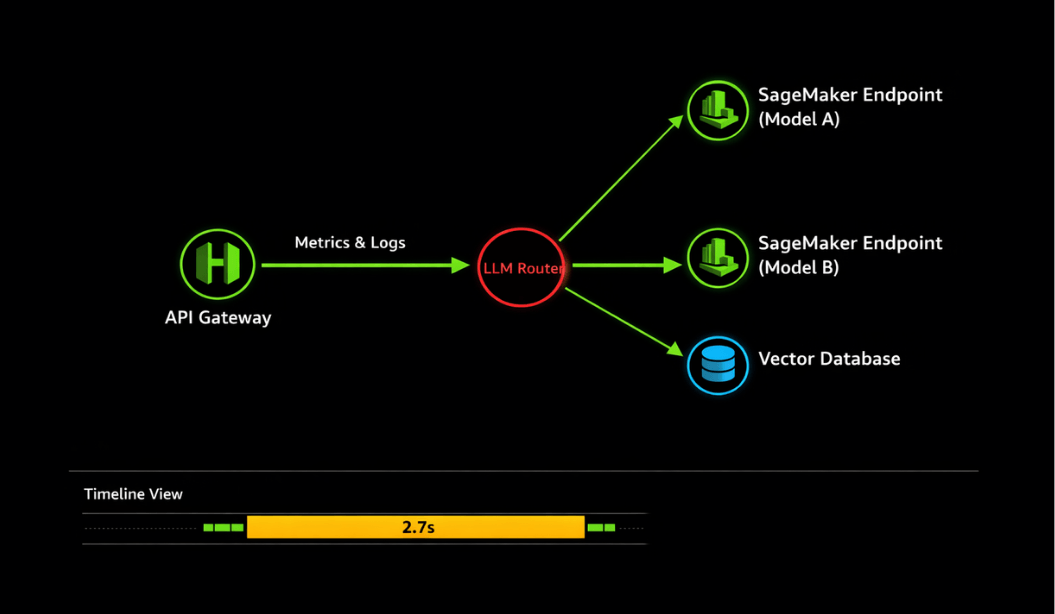
X-Ray distributed tracing pinpoints bottlenecks across complex request flows. Production dashboards visualize metrics across all endpoints, enabling quick assessment of system health.
Cost optimization through metric resolution tuning, log retention policies, and metric math expressions keeps monitoring expenses minimal. For enterprise LLM deployments requiring reliability, performance visibility, and SLA compliance, CloudWatch provides the essential monitoring foundation.
Start with essential metrics like P95 latency and error rates, configure alerts at 80% of SLA thresholds for warnings, and expand monitoring as your deployment scales to maintain production excellence.
Frequently Asked Questions
What metrics should I prioritize for LLM inference monitoring?
Focus on these critical metrics in priority order:
| Priority | Metric | Alert Condition | Why It Matters |
|---|---|---|---|
| 1 | Request latency percentiles (P50, P95, P99) | P95 >2x baseline (warning); >5x baseline (critical) | Capacity issues |
| 2 | Throughput (requests/second, tokens/second) | Sudden drop | Signals problems |
| 3 | Error rate percentage | Spike >1% (critical) | Immediate investigation required |
| 4 | GPU utilization | Sustained <60% (over-provisioning); >95% (under-capacity) | Cost efficiency + capacity planning |
| 5 | Queue depth | Growing queues | Predicts future latency problems |
Set CloudWatch alarms: P95 latency >2x baseline (warning) or >5x baseline (critical), error rate >1% (critical), GPU memory >90% (warning). Monitor these via CloudWatch dashboards with 1-minute granularity for production endpoints. Secondary metrics includes:
| Metric | Purpose |
|---|---|
| Model loading time | Deployment efficiency |
| Cache hit rates | Inference optimization |
| Cold start frequency | Auto-scaling deployments |
How do I troubleshoot high latency spikes in CloudWatch?
Troubleshooting High Latency Spikes - Correlation Steps
| Symptom | Check | Root Cause | Mitigation |
|---|---|---|---|
| GPU utilization maxed at 100% | GPU metric during spike | Capacity exhausted | Add instances or upgrade GPU |
| OOM errors | CloudWatch Logs Insights | Memory exhaustion | Increase memory or optimize model |
| Timeout errors | CloudWatch Logs Insights | Model overload | Scale out |
| Growing queue depth | Concurrent requests metric | Traffic surge | Auto-scaling adjustment |
Use X-Ray traces to:
- Pinpoint bottlenecks in request path: tokenization → inference → post-processing
- Identify which stage contributes most to latency
- Create correlation rules linking high latency with:
- Increased request rate
- GPU throttling events
- Instance health check failures
Enable detailed monitoring (1-minute intervals) versus standard (5-minute) to catch transient issues. For persistent problems, enable SageMaker Debugger to profile GPU kernel execution and identify slow operations.
Can I integrate CloudWatch with external monitoring tools like Datadog?
Yes, CloudWatch Integration with External Tools
| Tool | Integration Method | Data Latency | Cost Implication |
|---|---|---|---|
| Datadog | AWS integration (polls API) | 5-10 minutes | Lower cost |
| Datadog | CloudWatch Metric Streams + Kinesis Firehose | 60 seconds | Higher cost |
| Prometheus/Grafana | CloudWatch Exporter or ADOT | Real-time | Moderate |
| New Relic/Splunk/Elastic | Native connectors | Varies | Varies |
Metric Streams Cost Warning
| Scenario | Cost Impact |
|---|---|
| Metric streams at $0.003/metric update | $500-2,000/month for busy inference endpoints with 100+ metrics |
For cost-sensitive deployments, stick with CloudWatch native dashboards and use integrations only for critical metrics requiring correlation with non-AWS data sources or consolidated multi-cloud views.
How do I send custom LLM metrics to CloudWatch using Python?
Use the boto3 CloudWatch client's put_metric_data() call with a dedicated namespace, as shown earlier in this guide's Custom Application Metrics example. Each metric entry specifies a MetricName, Value, Unit, and optional Dimensions for filtering by model or environment:
import boto3

cloudwatch = boto3.client('cloudwatch')

cloudwatch.put_metric_data(
    Namespace='LLM/Production',
    MetricData=[
        {
            'MetricName': 'TokensGenerated',
            'Value': tokens_generated,
            'Unit': 'Count',
            'Dimensions': [
                {'Name': 'Model', 'Value': 'llama-70b'},
                {'Name': 'Environment', 'Value': 'production'}
            ]
        }
    ]
)
Summarize this post with: