AWS Cost Explorer: The Complete Guide to Monitoring, Analyzing, and Optimizing AWS Cloud Costs
Learn how to use AWS Cost Explorer to analyze cloud spending, forecast costs, optimize AWS resources, and improve FinOps with expert best practices.

As cloud environments grow, managing AWS costs becomes increasingly challenging. Applications scale, new services are deployed, storage expands, and engineering teams launch additional infrastructure to support business growth. Without proper visibility into cloud spending, organizations often struggle to understand where their budget is being consumed.
This is where AWS Cost Explorer becomes one of the most valuable tools available in the AWS Management Console.
AWS Cost Explorer helps organizations visualize, analyze, and forecast cloud spending through interactive reports, filtering capabilities, and usage analytics. Instead of manually reviewing invoices or downloading billing reports, teams can quickly identify which AWS services, accounts, applications, or business units are driving cloud costs.
Whether you're trying to investigate a sudden increase in your AWS bill, monitor departmental spending, optimize infrastructure, or build a long-term FinOps strategy, AWS Cost Explorer provides the insights needed to make informed financial decisions.
In this guide, you'll learn how AWS Cost Explorer works, its key features, best practices, limitations, and how it fits into a broader AWS cost optimization strategy.
TL;DR
- AWS Cost Explorer is the native cost visibility tool – interactive dashboards, historical analysis, and forecasting. Essential for understanding cloud spend.
- Tagging is non-negotiable – tag resources by department, application, environment, project. Without tags, you can't attribute costs to teams or projects.
- Filter by service, region, account, instance type, purchase option – isolate exactly what's driving costs.
- Forecasting predicts future spend using historical patterns – critical for budgeting and avoiding surprises.
- Cost Explorer shows where money goes – it doesn't fix waste. Combine with Compute Optimizer (rightsizing), Trusted Advisor (idle resources), and Budgets (alerts) for a complete optimization workflow.
What Is AWS Cost Explorer?
AWS Cost Explorer is a native AWS billing and cost analysis tool that enables organizations to visualize historical cloud spending, analyze usage trends, forecast future costs, and identify optimization opportunities.
Unlike a monthly invoice that simply shows how much was spent, Cost Explorer helps answer questions such as:
- Which AWS service generated the highest cost this month?
- Why did cloud spending increase compared to last month?
- Which AWS account is responsible for most infrastructure costs?
- How much are Amazon EC2 instances costing?
- Which projects consume the most storage?
- Are Reserved Instances or Savings Plans reducing cloud expenses?
- How will next month's AWS bill likely change?
Instead of working with raw billing data, users receive interactive charts, customizable reports, and detailed cost breakdowns.
For organizations adopting FinOps, AWS Cost Explorer serves as one of the foundational visibility tools.
Why AWS Cost Visibility Matters
One of the biggest challenges in cloud computing is the lack of cost transparency.
Unlike traditional on-premises infrastructure, cloud resources are continuously created, modified, scaled, and removed.
Engineering teams may deploy:
- Amazon EC2 instances
- Amazon RDS databases
- Amazon ECS clusters
- Amazon EKS workloads
- AWS Lambda functions
- Amazon S3 storage
- Elastic Load Balancers
- Amazon CloudFront distributions
- Amazon ElastiCache clusters
Each service contributes to the overall AWS bill.
Without centralized visibility, organizations often discover overspending only after receiving the monthly invoice.
AWS Cost Explorer changes this by allowing teams to monitor spending continuously rather than reactively.
How AWS Cost Explorer Works
AWS Cost Explorer collects billing and usage information directly from your AWS account.
After enabling the service, AWS processes billing data and makes it available through interactive dashboards.
Cost Explorer analyzes:
- Historical costs
- Resource usage
- Forecasted spending
- Reserved Instance utilization
- Savings Plans coverage
- Service-level expenses
- Account-level spending
- Usage trends
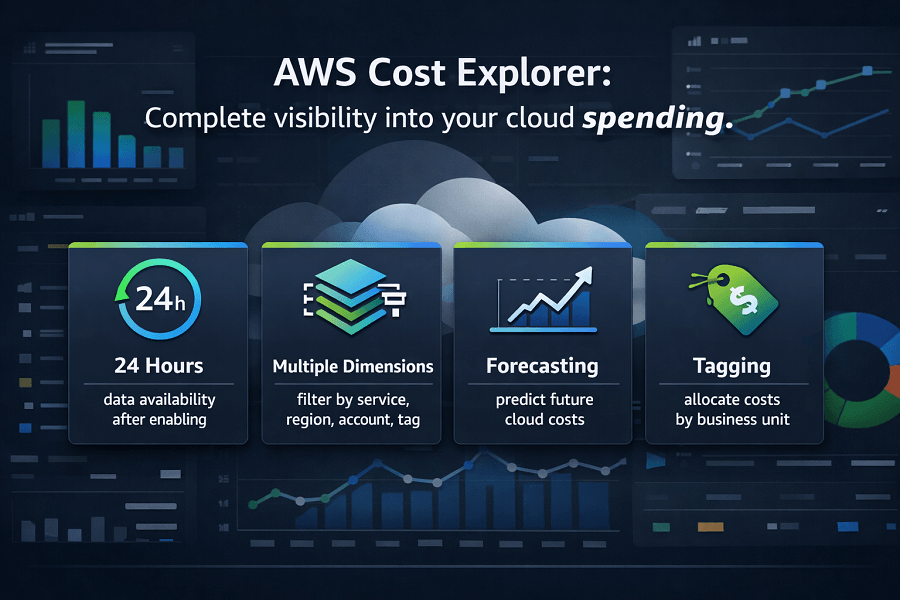
Most organizations begin seeing historical billing data within approximately 24 hours after enabling Cost Explorer, although complete historical data may take additional time to populate depending on the account.
Because Cost Explorer integrates directly with AWS Billing, no third-party software is required.
Key Features of AWS Cost Explorer
AWS Cost Explorer offers far more than simple cost reporting.
Its features help organizations understand both current and future cloud spending
1. Historical Cost Analysis
Cost Explorer provides historical spending data that helps organizations understand how cloud costs have evolved over time.
Users can review:
- Daily costs
- Monthly costs
- Annual spending trends
Historical analysis is especially valuable when investigating unexpected increases in AWS bills.
For example:
A sudden rise in Amazon EC2 costs may correspond with a new application deployment, while increasing Amazon S3 costs may indicate rapid storage growth.
Understanding historical patterns helps engineering and finance teams make better infrastructure decisions.
2. Cost Forecasting
One of Cost Explorer's most valuable capabilities is forecasting.
Using historical billing patterns, AWS estimates future cloud spending.
Forecasts help organizations:
- Plan budgets
- Estimate project costs
- Prepare for seasonal traffic
- Monitor spending growth
Although forecasts are estimates rather than guarantees, they provide valuable insight into future infrastructure expenses.
3. Filter Costs by AWS Service
Organizations often want to know exactly which services contribute most to cloud spending.
AWS Cost Explorer allows filtering by service, including:
- Amazon EC2
- Amazon RDS
- Amazon S3
- AWS Lambda
- Amazon CloudFront
- Amazon EKS
- Amazon ECS
- Amazon DynamoDB
- Elastic Load Balancing
- AWS Backup
This enables teams to quickly identify which services deserve optimization efforts.
4. Group Costs by Different Dimensions
Rather than viewing a single monthly invoice, users can organize spending by multiple dimensions.
Examples include:
By AWS Service
Understand how much each service contributes to total spending.
By Linked Account
Useful for organizations using AWS Organizations.
By Region
Identify expensive AWS Regions.
By Availability Zone
Analyze localized infrastructure costs.
By Usage Type
Understand what specific usage generated charges.
By API Operation
Provides highly detailed billing analysis.
By Cost Allocation Tag
Essential for organizations implementing FinOps.
Grouping data by tags allows finance teams to allocate cloud costs across departments, applications, or customers.
Understanding the Cost Explorer Dashboard
The AWS Cost Explorer dashboard provides an interactive interface for exploring cloud spending.
Key dashboard components include:
Cost Graph
Visualizes spending trends over time.
Users can switch between:
- Daily view
- Monthly view
- Amortized cost
- Blended cost
- Unblended cost
Charts make it easier to identify spending spikes that might otherwise go unnoticed.
Filter Panel
Filters allow users to narrow analysis based on:
- AWS Service
- Region
- Account
- Tags
- Usage Type
- Instance Type
- Purchase Option
This flexibility makes Cost Explorer useful for both technical and financial teams.
Cost Breakdown Table
Below the chart, Cost Explorer displays detailed numerical values that support graphical analysis.
Users can export these reports for additional analysis or stakeholder reporting.
Common Questions AWS Cost Explorer Can Answer
Organizations frequently use Cost Explorer to answer practical business questions such as:
- Why did my AWS bill increase this month?
- Which application costs the most?
- Which department exceeded its budget?
- Which AWS service should we optimize first?
- Are Savings Plans reducing compute costs?
- How much are Amazon RDS databases costing?
- Which Regions generate the highest expenses?
- How has spending changed during the last six months?
These insights form the foundation of an effective cloud cost optimization strategy.
Using Filters to Analyze AWS Costs More Effectively
One of the biggest strengths of AWS Cost Explorer is its ability to filter cloud spending from multiple perspectives.
Rather than viewing your AWS bill as a single total, filters allow you to isolate costs and identify exactly where your budget is being spent.
Depending on your environment, you may want to analyze spending by service, region, account, instance type, purchase option, or business unit.
Let's look at the most useful filters.
Filter by AWS Service
Most organizations begin by identifying which AWS services contribute the highest percentage of monthly spending.
Common services include:
- Amazon EC2
- Amazon RDS
- Amazon S3
- Amazon EKS
- Amazon ECS
- AWS Lambda
- Amazon CloudFront
- Amazon DynamoDB
- Amazon ElastiCache
- Amazon Redshift
- Amazon Route 53
- AWS Backup
- Amazon OpenSearch Service
For example, if Amazon EC2 accounts for 45% of your monthly bill, you immediately know where optimization efforts should begin.
Questions you can answer include:
- Which service costs the most?
- Which service experienced the highest monthly increase?
- Are new services increasing infrastructure costs?
- Which workloads deserve a Well-Architected Review?
Filter by AWS Region
Many organizations operate workloads across multiple AWS Regions.
Cost Explorer allows spending analysis by Region, helping teams identify where infrastructure costs are concentrated.
Example Regions include:
- US East (N. Virginia)
- US East (Ohio)
- US West (Oregon)
- Europe (Ireland)
- Europe (London)
- Asia Pacific (Singapore)
- Asia Pacific (Sydney)
This is particularly useful for organizations that have:
- Multi-region deployments
- Disaster recovery environments
- Global SaaS platforms
- International customers
Regional cost analysis often reveals duplicate infrastructure or workloads running in unnecessarily expensive Regions.
Filter by Linked AWS Account
Organizations using AWS Organizations typically manage multiple AWS accounts.
Examples include:
- Production
- Development
- Testing
- Shared Services
- Customer-specific environments
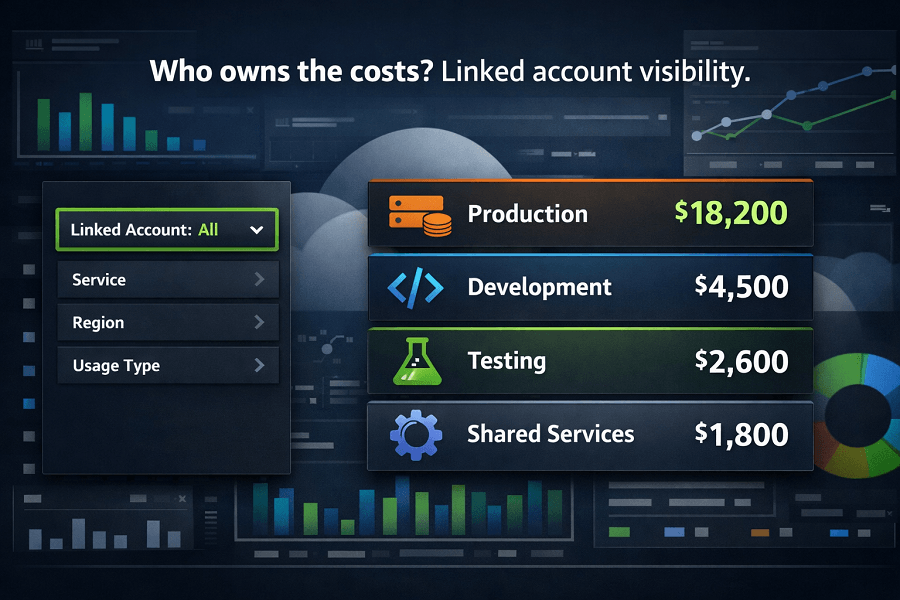
Cost Explorer enables administrators to compare spending across every linked account.
Benefits include:
- Department-level reporting
- Customer billing
- Internal chargeback
- Budget allocation
- Infrastructure governance
Without account-level visibility, cloud spending quickly becomes difficult to manage as organizations grow.
Filter by Instance Type
For Amazon EC2 workloads, Cost Explorer allows analysis based on instance family.
Examples include:
- t3
- t4g
- m6i
- c7g
- r7g
- x2idn
This helps answer questions like:
- Which instance family generates the highest monthly costs?
- Are compute-optimized instances being used appropriately?
- Can workloads be rightsized?
Combining instance type analysis with AWS Compute Optimizer recommendations often uncovers substantial cost-saving opportunities.
Filter by Purchase Option
Understanding how workloads are billed is critical for cloud optimization.
AWS Cost Explorer allows filtering by purchase model.
These include:
On-Demand Instances
Ideal for:
- Short-term workloads
- Development environments
- Temporary infrastructure
Higher hourly costs but maximum flexibility.
Reserved Instances
Designed for predictable production workloads.
Reserved Instances reduce costs through long-term commitments.
Best suited for:
- Databases
- Core application servers
- Stable enterprise workloads
Savings Plans
Savings Plans provide pricing flexibility while offering significant discounts compared to On-Demand pricing.
Many organizations now prefer Savings Plans because they automatically apply discounts across eligible compute services.
Spot Instances
Spot Instances utilize unused AWS capacity at significantly lower prices.
Ideal for:
- Batch processing
- Machine learning
- Video rendering
- CI/CD pipelines
- Analytics workloads
Understanding purchase options helps engineering teams determine whether they are paying more than necessary.
Using Cost Allocation Tags
As AWS environments grow, understanding which project or department owns specific resources becomes increasingly difficult.
This is where Cost Allocation Tags become essential.
Cost Allocation Tags attach business metadata to AWS resources.
Examples include:
- Application
- Department
- Environment
- Project
- Customer
- Team
- Business Unit
- Owner
- Cost Center
Once activated, Cost Explorer can group spending using these tags.
For example:
Instead of one large AWS invoice, organizations gain meaningful financial visibility.
This is one of the foundational principles of FinOps.
Understanding Amortized vs Unblended Costs
Many AWS users become confused when comparing invoices with Cost Explorer reports.
The reason usually involves different cost views.
Unblended Cost
Shows the actual amount charged during a billing period.
Useful for:
- Monthly invoices
- Department reporting
- Expense tracking
Amortized Cost
Distributes Reserved Instance and Savings Plan commitments across the period they cover.
Useful for:
- Financial forecasting
- Long-term planning
- FinOps reporting
- Cloud ROI analysis
Most organizations use amortized costs when evaluating cloud optimization initiatives because they present a more accurate picture of infrastructure spending.
Reserved Instance Reporting
Cost Explorer includes dedicated reporting for Reserved Instances.
Organizations can monitor:
- Reservation utilization
- Reservation coverage
- Expiring reservations
- Potential savings
Low utilization often indicates that Reserved Instances were purchased incorrectly or workloads have changed.
Proper monitoring ensures businesses receive the full financial benefit of Reserved Instance investments.
Savings Plans Reporting
Savings Plans reports help organizations understand whether committed spending is being fully utilized.
Reports typically show:
- Savings achieved
- Coverage percentage
- Eligible On-Demand usage
- Remaining commitment
If large portions of compute remain billed at On-Demand rates, additional Savings Plans may reduce future cloud costs.
Identifying Rightsizing Opportunities
Cost Explorer itself doesn't recommend new instance sizes.
Instead, it works alongside AWS Compute Optimizer.
The process looks like this:
- Cost Explorer identifies expensive services.
- Compute Optimizer analyzes utilization.
- Engineering teams resize infrastructure.
- Cost Explorer verifies spending reductions.
This combination provides one of the most effective cloud optimization workflows available within AWS.
Cost Explorer vs AWS Budgets
Although both tools relate to cloud spending, they serve different purposes.
Many organizations use both together.
Cost Explorer explains why costs changed.
AWS Budgets alerts teams before spending exceeds expectations.
Cost Explorer vs AWS Trusted Advisor
AWS Trusted Advisor focuses on optimization recommendations.
Examples include:
- Idle Elastic IPs
- Underutilized EC2 instances
- Idle Load Balancers
- Service limits
- Security recommendations
Cost Explorer focuses on financial visibility.
Together they create a complete optimization workflow.
Trusted Advisor identifies waste.
Cost Explorer measures financial impact.
Cost Explorer vs AWS Cost and Usage Report (CUR)
Organizations frequently compare Cost Explorer with the AWS Cost and Usage Report.
While both use billing data, they serve different audiences.
AWS Cost Explorer
Best for:
- Interactive dashboards
- Finance teams
- Cloud administrators
- Monthly reporting
- Forecasting
Easy to use with no technical expertise required.
Cost and Usage Report (CUR)
Best for:
- Enterprise analytics
- Custom dashboards
- FinOps teams
- Business intelligence
- Chargeback models
CUR contains the most detailed billing dataset available within AWS but requires additional tools such as Amazon Athena, Amazon QuickSight, or third-party BI platforms for analysis.
Many enterprises use Cost Explorer for day-to-day visibility and CUR for advanced financial reporting.
Best Practices for Using AWS Cost Explorer
Organizations receive significantly more value from Cost Explorer when it becomes part of a regular cloud governance process.
Recommended best practices include:
- Review cloud spending every week instead of waiting for monthly invoices.
- Enable Cost Allocation Tags before cloud environments become difficult to organize.
- Compare costs across AWS Regions regularly.
- Review EC2 spending alongside Compute Optimizer recommendations.
- Monitor Savings Plan and Reserved Instance utilization monthly.
- Investigate unexpected spending spikes immediately.
- Share Cost Explorer reports with engineering and finance stakeholders.
- Combine Cost Explorer with AWS Budgets and AWS Trusted Advisor for complete financial visibility.
When used consistently, Cost Explorer becomes more than a reporting tool, it becomes the foundation of continuous cloud cost optimization.
Common AWS Cost Explorer Mistakes
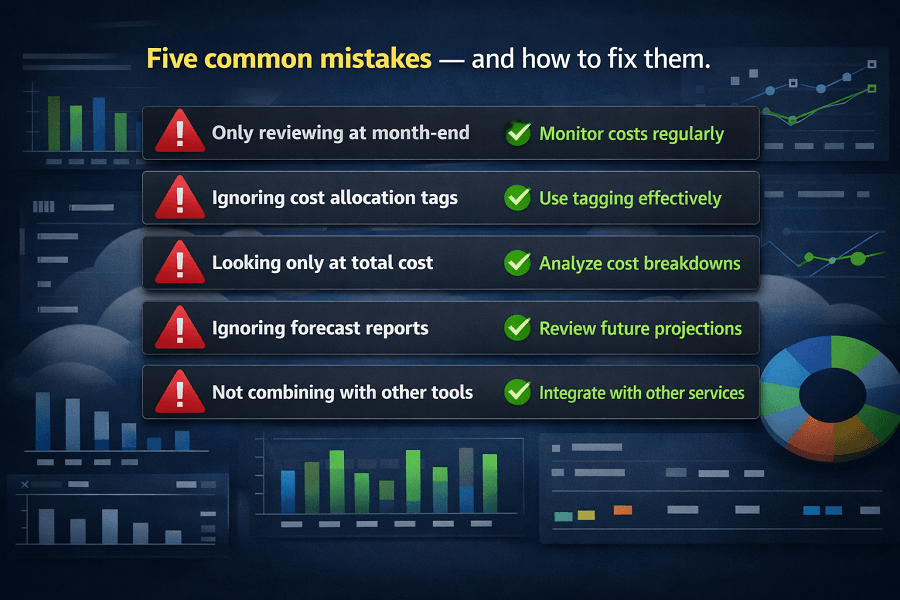
Simply enabling AWS Cost Explorer doesn't guarantee lower cloud costs. Many organizations only use a fraction of its capabilities, missing opportunities to optimize spending.
Below are some of the most common mistakes.
1. Only Reviewing Costs at the End of the Month
One of the biggest mistakes is waiting until the monthly AWS invoice arrives before investigating cloud spending.
By that point:
- The costs have already been incurred.
- Temporary resources may have been running for weeks.
- Unexpected usage has already impacted the budget.
Instead, engineering and finance teams should review Cost Explorer weekly or even daily for larger environments to identify anomalies before they become expensive.
2. Ignoring Cost Allocation Tags
Without Cost Allocation Tags, Cost Explorer can only show spending at a technical level.
It becomes difficult to answer questions such as:
- Which customer generated these AWS costs?
- Which application owns these EC2 instances?
- Which department exceeded its budget?
Organizations should implement a standardized tagging strategy from the beginning.
Recommended tags include:
- Environment
- Project
- Owner
- Team
- Business Unit
- Cost Center
- Customer
- Application
Proper tagging improves visibility and simplifies budgeting, reporting, and chargeback processes.
3. Looking Only at Total Cost
Many users focus only on the total monthly bill.
Instead, Cost Explorer should be used to identify:
- Cost trends
- Cost anomalies
- High-growth services
- Seasonal spending
- Regional differences
- Purchase option utilization
Understanding why costs changed is far more valuable than simply knowing how much was spent.
4. Ignoring Forecast Reports
Forecasting is one of Cost Explorer's most underutilized features.
Forecast reports help organizations:
- Predict next month's AWS bill
- Estimate infrastructure growth
- Prepare project budgets
- Avoid unexpected spending increases
This is particularly valuable for:
- SaaS companies
- E-commerce businesses
- Seasonal workloads
- AI and machine learning projects
Rather than reacting to cloud costs, businesses can proactively plan for them.
5. Not Combining Cost Explorer with Other AWS Tools
AWS Cost Explorer provides visibility but it doesn't automatically fix inefficiencies.
The most effective cloud optimization strategies combine several AWS services.
For example:
Together, these services provide a comprehensive cloud financial management framework.
Building a FinOps Workflow with AWS Cost Explorer
FinOps is the practice of bringing together engineering, finance, and business teams to manage cloud spending collaboratively.
AWS Cost Explorer plays a central role in this process by providing the financial visibility needed to make informed decisions.
A simple monthly FinOps workflow might look like this:
Step 1: Review Monthly Spending
Use AWS Cost Explorer to compare current spending with previous months.
Identify:
- Cost increases
- New services
- Seasonal patterns
- Forecast changes
Step 2: Identify High-Cost Services
Filter spending by AWS service to determine which resources consume the largest share of the budget.
Typical focus areas include:
- Amazon EC2
- Amazon RDS
- Amazon S3
- Amazon EKS
- AWS Lambda
Step 3: Investigate Resource Utilization
Use AWS Compute Optimizer and Amazon CloudWatch to determine whether expensive resources are appropriately sized.
Look for:
- Low CPU utilization
- Underused databases
- Idle storage
- Overprovisioned compute
Step 4: Optimize Pricing Models
Review whether workloads are using:
- On-Demand Instances
- Savings Plans
- Reserved Instances
- Spot Instances
Migrating eligible workloads to more efficient pricing models can significantly reduce long-term cloud costs.
Step 5: Track Results
After implementing optimization changes, use AWS Cost Explorer to verify:
- Reduced monthly spending
- Improved utilization
- Budget performance
- Forecast accuracy
Optimization should be measured, not assumed.
Real-World Cost Explorer Use Cases
AWS Cost Explorer supports organizations across many industries.
Here are several practical examples.
SaaS Companies
A SaaS platform notices a 25% increase in monthly AWS costs.
Using Cost Explorer, engineers discover that newly deployed Amazon ECS services are consuming significantly more compute than expected.
Further analysis with AWS Compute Optimizer reveals opportunities to resize container instances, reducing infrastructure costs while maintaining application performance.
E-Commerce Businesses
An online retailer experiences increased cloud spending during the holiday season.
Cost Explorer forecasting helps estimate expected infrastructure costs based on historical trends, allowing finance teams to prepare budgets before traffic spikes occur.
Enterprise Organizations
A global enterprise manages dozens of AWS accounts through AWS Organizations.
Using Cost Allocation Tags and Cost Explorer, finance teams allocate cloud costs to individual business units, improving accountability and simplifying internal chargeback reporting.
AI and Machine Learning Workloads
Organizations training machine learning models often generate substantial compute costs.
Cost Explorer helps identify high-cost GPU instances and evaluate whether Spot Instances or Savings Plans could reduce overall expenses.
When AWS Cost Explorer Isn't Enough
Although Cost Explorer is an excellent native AWS service, very large organizations often require more advanced financial reporting.
Challenges may include:
- Multi-cloud environments
- Thousands of AWS accounts
- Customer-level billing
- Enterprise chargeback
- Executive dashboards
- Advanced forecasting
In these situations, organizations frequently integrate:
- AWS Cost & Usage Report (CUR)
- Amazon Athena
- Amazon QuickSight
- Third-party FinOps platforms
Cost Explorer remains valuable, but it becomes one component of a larger cloud financial management ecosystem.
How AWS Cost Explorer Supports AWS Cost Optimization
AWS Cost Explorer should not be viewed as an isolated billing tool.
Instead, it serves as the visibility layer for an ongoing AWS cost optimization strategy.
Cost Explorer helps organizations:
- Detect unexpected spending
- Identify optimization opportunities
- Track cost-saving initiatives
- Measure infrastructure efficiency
- Validate architectural improvements
- Forecast future cloud investments
Combined with regular architecture reviews and governance processes, it enables organizations to make data-driven financial decisions.
Conclusion
AWS Cost Explorer is much more than a billing dashboard. It provides the visibility organizations need to understand where cloud budgets are being spent, identify cost trends, forecast future expenses, and measure the effectiveness of optimization initiatives.
However, meaningful cost reduction requires more than reporting. By combining Cost Explorer with services such as AWS Compute Optimizer, AWS Trusted Advisor, AWS Budgets, and the AWS Well-Architected Framework, organizations can establish a proactive cloud financial management strategy that balances performance with efficiency.
Whether you're managing a startup AWS account or a complex enterprise cloud environment, AWS Cost Explorer should be a core component of your cloud governance and FinOps practice.
If your organization needs expert guidance in interpreting AWS billing data, identifying optimization opportunities, or implementing a long-term cost management strategy, EaseCloud's AWS consulting team can help you maximize the value of every cloud investment.
Frequently Asked Questions
Is AWS Cost Explorer free?
AWS Cost Explorer is available at no additional charge for standard cost analysis features. However, certain advanced capabilities, such as hourly granularity or specialized reports, may incur additional costs depending on AWS pricing. Always review the latest AWS pricing documentation for current details.
How often is Cost Explorer updated?
Billing and usage data is typically updated at least once every 24 hours, although some reports may experience slight delays depending on the AWS service.
Can Cost Explorer identify unused resources?
Not directly.
Cost Explorer highlights where money is being spent, while services like AWS Trusted Advisor and AWS Compute Optimizer help identify idle or underutilized resources.
Does AWS Cost Explorer support forecasting?
Yes.
Cost Explorer uses historical spending data to estimate future cloud costs, helping organizations with budgeting and financial planning.
Can multiple AWS accounts be analyzed together?
Yes.
Organizations using AWS Organizations can analyze consolidated spending across linked accounts, making Cost Explorer suitable for enterprise environments.
How EaseCloud Helps Organizations Optimize AWS Costs
Understanding cloud spending is only the first step. The real value comes from translating billing insights into architectural improvements that reduce costs without compromising performance, reliability, or security.
At EaseCloud, our AWS consultants help organizations use AWS Cost Explorer as part of a broader cloud optimization strategy.