Prometheus vs. CloudWatch: Monitoring Tool Comparison
Compare Prometheus and CloudWatch to find the best monitoring tool for your needs. Learn how EaseCloud simplifies integration and boosts performance.

Monitoring solutions are essential for ensuring infrastructure and applications run smoothly in the current digital era. Selecting the best monitoring system for their requirements is essential for organizations aiming for peak performance and dependability.
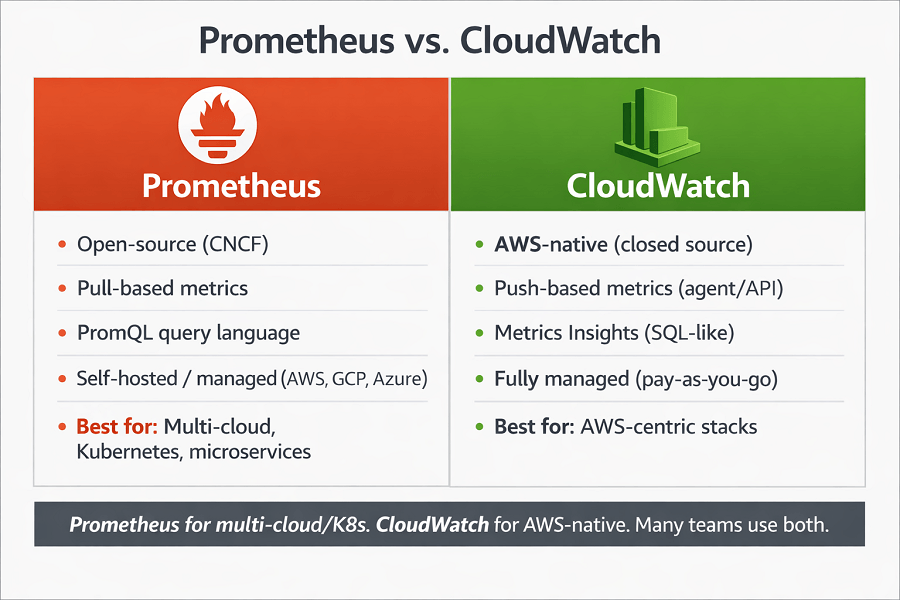
Prometheus and CloudWatch, two of the most popular technologies, are examined in this article. Our goal is to assist readers in making an informed choice by contrasting their features, capabilities, and use cases.
TL;DR
- Prometheus Strengths: Open-source, pull-based architecture, PromQL querying, and native Kubernetes integration ideal for containerized and microservices environments
- CloudWatch Benefits: Managed AWS service, seamless AWS integration, automatic scaling, and pay-as-you-go pricing perfect for AWS-centric infrastructures
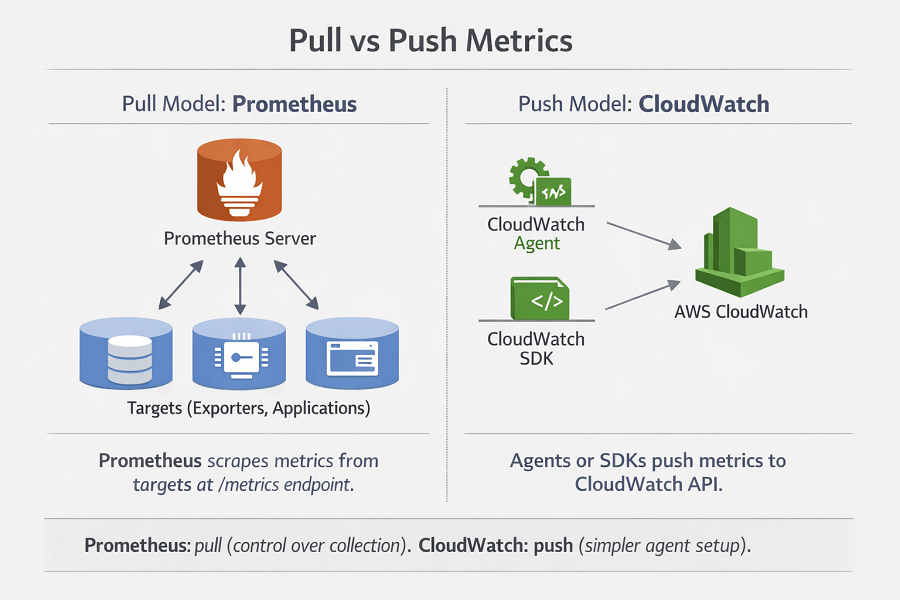
- Data Collection: Prometheus uses pull model with exporters while CloudWatch uses push model for simplified AWS resource monitoring
- Scalability Differences: CloudWatch auto-scales with AWS infrastructure, Prometheus requires additional tools like Grafana and Thanos for large deployments
- Cost Considerations: Prometheus is free open-source with infrastructure costs, CloudWatch charges consumption-based pricing that can increase with scale
- Security Features: CloudWatch includes built-in AWS security with IAM controls, Prometheus needs manual security configuration and authentication setup
- Integration Capabilities: Prometheus supports extensive third-party integrations, CloudWatch optimized for AWS ecosystem with limited external connectivity
- Use Case Selection: Choose Prometheus for multi-cloud/on-premises environments, CloudWatch for AWS-native applications and managed simplicity
Overview of Monitoring Tools
The foundation of IT infrastructure is made up of monitoring tools, which offer information on fault detection, resource usage, and system performance. They enable teams to proactively address possible problems, protecting user experience and business continuity.
Importance of Monitoring in Modern Applications
Monitoring is more important than ever due to the proliferation of applications and the increasing complexity of cloud-native infrastructures. It provides better user experiences, optimizes resource utilization, and guarantees system availability.
Purpose of This Article
This comparison explores Prometheus and CloudWatch's features, advantages, and disadvantages. Readers will be more prepared to select a monitoring system that suits their particular needs by the end.
Impact of EaseCloud on Monitoring with Prometheus and CloudWatch
EaseCloud enhances your monitoring strategy, whether you choose Prometheus, CloudWatch, or both. With our seamless integration capabilities, you can centralize data collection and streamline metrics tracking across platforms. EaseCloud's flexible infrastructure ensures your monitoring tools perform optimally, giving you deeper insights into system health and performance without the usual complexities.
Understanding Monitoring Tools
1.1 Definition of Monitoring Tools
To evaluate the functionality and health of IT systems, monitoring tools gather, examine, and present data. They make it possible for teams to quickly identify and resolve problems, guaranteeing seamless system operation.
1.2 Categories of Monitoring Tools
Monitoring tools generally fall into three main categories:
- Infrastructure Monitoring: Monitors hardware and software components like servers, networks, and storage systems.
- Application Performance Monitoring (APM): Tracks application metrics such as response time, error rates, and user experience.
- Log Management: Collects, stores, and analyzes log data to identify and troubleshoot issues effectively.
Overview of Prometheus
2.1 What is Prometheus?
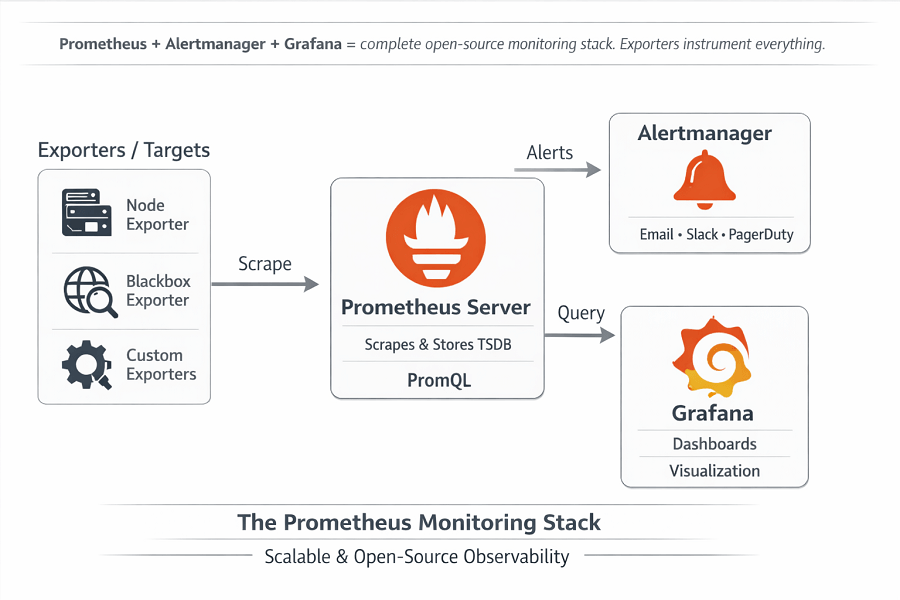
Prometheus, an open-source monitoring and alerting toolset, is renowned for its scalability and reliability. Originally developed at SoundCloud, it is currently extensively utilized for monitoring cloud-native deployments.
2.2 Key Features of Prometheus
- Time-Series Database:
- Multidimensional Data Model:
- PromQL (Query Language):
2.3 Use Cases for Prometheus
- Microservices Monitoring:
- Kubernetes Monitoring:
- Alerting Mechanisms:
Overview of CloudWatch
3.1 What is CloudWatch?
CloudWatch, a technology from Amazon Web Services (AWS), provides observability and monitoring for AWS resources and applications hosted on its platform.
3.2 Key Features of CloudWatch
- Metrics Collection:
- Log Monitoring:
- Event Monitoring and Automation:
3.3 Use Cases for CloudWatch
- AWS Resource Monitoring:
- Application Monitoring:
- Custom Metrics Collection:
Feature Comparison
4.1 Data Storage and Retrieval
- Prometheus: Makes use of a reliable time-series database to store metrics effectively.
- CloudWatch: Makes use of AWS's expandable storage system.
4.2 Querying Capabilities
- PromQL (Prometheus): The query language PromQL (Prometheus) is very adaptable and flexible.
- CloudWatch Metrics Insights: SQL-like searches customized for AWS setups are called CloudWatch Metrics Insights.
4.3 Alerting and Notifications
By supporting notifications depending on situations and thresholds, both systems allow for proactive problem-solving.
4.4 Integration with Other Tools
- Prometheus: Uses exporters and connectors to easily integrate with a variety of tools.
- CloudWatch: No longer requires third-party integrations because it is optimized for AWS ecosystems.
Prometheus for multi-cloud/K8s. CloudWatch for AWS-native. We help you choose and implement both.
Prometheus excels at Kubernetes and microservices (pull-based, PromQL, open-source). CloudWatch shines for AWS-centric stacks (seamless integration, auto-scaling, pay-as-you-go). Many teams use both.
Our observability experts help you:
- Choose based on your infrastructure – AWS-native = CloudWatch, multi-cloud/on-prem = Prometheus
- Implement Prometheus stack – Pull-based scraping, exporters, PromQL, Alertmanager
- Set up CloudWatch monitoring – Metrics, logs, alarms, dashboards for AWS resources
- Run both in parallel – Prometheus for K8s, CloudWatch for AWS-managed services
Performance Metrics
5.1 Data Collection Mechanisms
- Prometheus: Gathers data via a pull paradigm.
- CloudWatch: Simplifies connections to AWS resources by using a push paradigm.
5.2 Scalability
- Prometheus: Needs further tools for high-scale environments, such as Grafana
- CloudWatch: Adapts to changes in AWS infrastructure automatically.
5.3 Latency and Response Times
Both technologies provide stable response times under a variety of workloads, while performance varies depending on the use case.
Pricing Models
6.1 Cost Structure of Prometheus
Prometheus is open-source and free to use, though additional infrastructure and support costs may apply.
6.2 Cost Structure of CloudWatch
CloudWatch costs based on consumption and is a pay-as-you-go service. To stay within their budget, AWS users need to keep an eye on their spending.
Ease of Use
Installation and Setup
- Prometheus: Needs to be manually configured and set up.
- CloudWatch: Provides cutting-edge functionality and seamlessly integrates with AWS.
User Interface and Usability
The user interfaces of both tools are simple to use. Compatibility with Grafana is advantageous.
Learning Curve
AWS users may find CloudWatch easy to use, however, Prometheus might require knowledge of PromQL.
Security and Compliance
Security Features
- Prometheus: requires manual configuration for authentication and network security.
- CloudWatch: Makes use of AWS's strong security features, such as IAM controls and encryption.
Compliance Standards
Prometheus needs special setups to satisfy legal requirements, in contrast to CloudWatch, which complies with AWS compliance rules.
Community and Support
- Prometheus: Supported by a thriving open-source community that provides a wealth of documentation and discussion boards.
- CloudWatch: Backed by AWS's professional services and vast knowledge base.
Conclusion
Summary of Key Points
Prometheus and CloudWatch are both excellent at monitoring, despite their different roles. While Prometheus provides flexibility and is best suited for open-source enthusiasts, CloudWatch is a seamless option for AWS clients.
Final Thoughts
The decision between Prometheus and CloudWatch depends on your infrastructure, expertise, and requirements. EaseCloud.io experts can guide you in selecting and implementing the ideal monitoring solution.
Frequently Asked Questions
Which tool is better for microservices?
Prometheus vs. CloudWatch for Microservices:
| Aspect | Prometheus | CloudWatch |
|---|---|---|
| Architecture | Pull-based, service discovery | Push-based, AWS-native |
| Dynamic environments | ✅ Excels – auto-detects new instances | ⚠️ May require configuration |
| On-premises/hybrid cloud | ✅ Appropriate | ❌ Not appropriate (AWS-specific integration) |
| Operational overhead | Self-managed | ✅ Managed – no infrastructure to oversee |
| Real-time metrics | ✅ Excellent | ✅ Good |
| Best for | Multi-cloud, hybrid, dynamic microservices | AWS-only microservices, simpler setup |
Decision: Prometheus for dynamic, multi-cloud environments; CloudWatch for AWS-only deployments where simplicity matters.
Can Prometheus integrate with AWS?
Prometheus Integration with AWS:
| Requirement | Solution | Operational Overhead |
|---|---|---|
| Monitor AWS resources (EC2, S3, RDS) | CloudWatch Exporter | Moderate |
| Host Prometheus on AWS | EC2 or EKS | Moderate |
| Hybrid/multi-cloud systems | Prometheus + exporters | Higher (more flexible) |
| AWS-native monitoring | CloudWatch | Minimal |
Key advantage of Prometheus for AWS: Integrates monitoring for both AWS and non-AWS systems, ensuring a consistent view across environments.
Prometheus AWS Integration Stack:
| Component | Purpose |
|---|---|
| Prometheus | Metrics collection |
| CloudWatch Exporter | Fetch AWS CloudWatch metrics |
| EC2 or EKS | Host Prometheus on AWS infrastructure |
How do Prometheus and CloudWatch handle scalability for monitoring large-scale systems?
Scalability Comparison:
| Aspect | Prometheus | CloudWatch |
|---|---|---|
| Data collection | Pull-based, handles high-cardinality metrics | Managed service, auto-scales |
| Large-scale scaling | Requires extra infrastructure (Thanos, Cortex) | ✅ Seamless – no extra setup |
| Long-term storage | Requires Thanos or Cortex | ✅ Managed (at a cost) |
| Operational ease | Self-managed scaling | ✅ Fully managed |
Prometheus Scaling Tools:
| Tool | Purpose |
|---|---|
| Thanos | Distributed monitoring, long-term storage |
| Cortex | Distributed monitoring, long-term storage |
Can Prometheus and CloudWatch integrate with other observability tools?
Yes. Observability Tool Integrations:
| Integration Type | Prometheus | CloudWatch |
|---|---|---|
| Visualization | Grafana | CloudWatch dashboards (native) |
| Distributed tracing | Jaeger | AWS X-Ray |
| Log forwarding | Loki (add-on) | AWS Lambda → Splunk/Elasticsearch |
| Full-stack observability | ✅ Yes (composable) | ✅ Yes (AWS ecosystem) |
Observability Stack Recommendations:
| Goal | Recommended Combination |
|---|---|
| Full-stack observability (Prometheus ecosystem) | Prometheus + Grafana + Jaeger + Loki |
| Full-stack observability (AWS ecosystem) | CloudWatch + X-Ray + Lambda log forwarding |
| Cross-platform unified view | Prometheus + CloudWatch Exporter |
What security features do Prometheus and CloudWatch offer for monitoring?
Security Features Comparison:
| Security Aspect | Prometheus | CloudWatch |
|---|---|---|
| Authentication/Authorization | Requires reverse proxy or Grafana | ✅ IAM policies (built-in) |
| Encryption in transit | TLS (manual setup) | ✅ Built-in |
| Encryption at rest | Manual configuration | ✅ Built-in |
| Centralized security alerts | Manual integration | ✅ AWS Security Hub |
| Managed security | No (self-managed) | ✅ Yes (managed service) |
CloudWatch Security Integration:
| Component | Security Function |
|---|---|
| IAM | Access management (authentication + authorization) |
| AWS Security Hub | Centralized security alert monitoring |
| Encryption (in transit/at rest) | Built-in data protection |