AWS Cost and Usage Report (CUR): The Complete Guide to AWS Billing Analytics and Cost Intelligence
Learn how AWS Cost and Usage Report (CUR) enables detailed billing analytics, chargeback, cost allocation, FinOps, and enterprise cloud reporting.

As organizations expand their AWS environments, understanding cloud spending becomes increasingly complex. While tools like AWS Cost Explorer provide visual summaries of cloud costs, many enterprises require deeper insights into exactly how, where, and why money is being spent.
Questions such as:
- Which business unit generated the highest AWS costs?
- Which applications consume the most compute resources?
- How much did Amazon S3 storage increase this month?
- Which development team exceeded its cloud budget?
- Which tags contribute the highest monthly spending?
cannot always be answered through dashboards alone.
For organizations that need detailed billing analytics, AWS provides the AWS Cost and Usage Report (CUR).
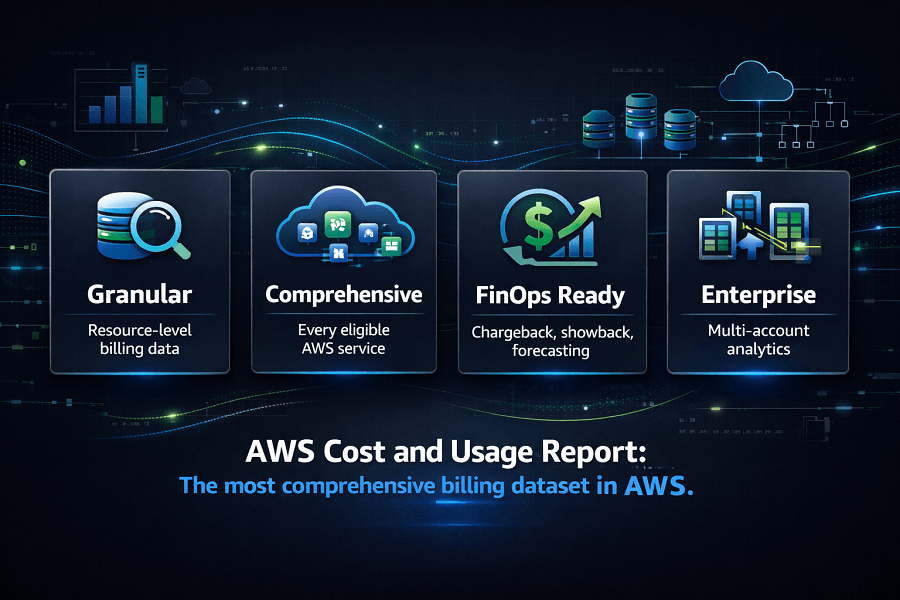
AWS Cost and Usage Report is the most comprehensive billing dataset available within AWS. It contains detailed information about every eligible AWS resource, usage record, pricing dimension, discount, reservation, Savings Plan benefit, and cost allocation attribute.
Rather than presenting summarized billing information, CUR delivers raw usage and cost data that organizations can analyze using services such as Amazon Athena, AWS Glue, Amazon QuickSight, or external business intelligence platforms.
For organizations implementing FinOps, chargeback, showback, cost governance, or enterprise cloud reporting, AWS CUR serves as the foundation for financial decision-making.
What This Guide Covers
- What AWS Cost and Usage Report is
- How CUR works
- CUR file structure
- Amazon S3 integration
- AWS Glue integration
- Amazon Athena querying
- Amazon QuickSight dashboards
- Cost allocation tags
- Chargeback and showback
- Best practices
- Common mistakes
- How CUR supports enterprise AWS Cost Optimization
What Is AWS Cost and Usage Report (CUR)?
AWS Cost and Usage Report (CUR) is a detailed billing report that contains comprehensive information about AWS resource usage and associated costs.
Unlike summary reports, CUR captures granular billing records for eligible AWS services across your accounts.
Each report may include details such as:
- AWS service used
- Usage quantity
- Pricing model
- Resource identifiers
- AWS Region
- Availability Zone
- Linked account
- Usage type
- Operation
- Cost allocation tags
- Savings Plans discounts
- Reserved Instance benefits
- Blended and unblended costs
- Taxes and credits (where applicable)
Because CUR provides this level of detail, it becomes the authoritative source for enterprise cloud cost analysis.
Why AWS CUR Matters
Cloud spending involves far more than monthly invoices.
Modern organizations require answers to operational and financial questions such as:
- Which projects are increasing cloud costs?
- Which departments consume the largest AWS budgets?
- Which workloads should be optimized first?
- Are Savings Plans being fully utilized?
- Which AWS Regions generate the highest expenses?
- Which services drive unexpected spending?
CUR enables organizations to answer these questions using detailed billing data rather than estimates or summarized dashboards.
This makes it an essential component of mature FinOps practices.
How AWS CUR Works
AWS Cost and Usage Report follows a structured reporting workflow.
Step 1: Billing Data Collection
AWS continuously collects billing and usage information from supported AWS services.
This includes compute, storage, networking, databases, analytics, AI services, and many other resource types.
Step 2: Report Generation
AWS generates Cost and Usage Reports according to the configured schedule.
Organizations can choose report settings based on their operational requirements.
Reports are updated as billing information becomes available, providing near-continuous visibility into cloud costs.
Step 3: Amazon S3 Storage
Generated reports are delivered to an Amazon S3 bucket specified during configuration.
This bucket becomes the central repository for billing data.
Many organizations create dedicated S3 buckets exclusively for billing reports to simplify governance and access management.
Step 4: Data Processing
After reports are stored in Amazon S3, they can be processed using services such as:
- Amazon Athena
- AWS Glue
- Amazon QuickSight
- Third-party BI platforms
- Custom SQL queries
- Data warehouses
This transforms raw billing data into actionable business intelligence.
Information Included in CUR
One of CUR's greatest strengths is the breadth of information it contains.
Depending on configuration, reports may include:
Billing Information
- Invoice details
- Billing periods
- Linked accounts
- Management account
- Currency
Resource Information
- Resource IDs
- Service names
- Regions
- Availability Zones
- Usage types
- Operations
Pricing Information
- On-Demand pricing
- Savings Plans discounts
- Reserved Instance discounts
- Spot pricing
- Public pricing
- Effective cost
Usage Information
- Compute hours
- Storage consumption
- Data transfer
- Requests
- API usage
- Database operations
Cost Allocation Information
Organizations using cost allocation tags can group expenses by:
- Department
- Team
- Project
- Customer
- Environment
- Cost Center
- Business Unit
- Application
This makes CUR especially valuable for enterprises implementing internal cost allocation models.
CUR File Format
AWS delivers CUR in structured formats designed for large-scale analytics.
Common formats include:
- Apache Parquet
- CSV (where applicable)
Parquet is generally preferred because it:
- Compresses data efficiently
- Reduces storage costs
- Improves query performance
- Integrates well with Amazon Athena
Large enterprises processing billions of billing records typically rely on Parquet for better scalability.
Amazon S3 Integration
Every Cost and Usage Report is delivered to an Amazon S3 bucket.
Best practices include:
- Creating a dedicated billing bucket
- Restricting access using IAM policies
- Enabling server-side encryption
- Applying lifecycle policies to manage older reports
- Enabling versioning where appropriate
- Monitoring bucket access with AWS CloudTrail
Proper S3 governance ensures billing data remains secure while controlling storage costs.
AWS Glue Integration
AWS Glue simplifies working with CUR by automatically discovering report schemas and creating metadata tables.
Using AWS Glue, organizations can:
- Crawl CUR datasets
- Maintain schema consistency
- Build Data Catalog tables
- Prepare billing data for analytics
- Support downstream reporting tools
This removes much of the manual effort involved in preparing CUR data for analysis.
Amazon Athena Integration
Amazon Athena is one of the most popular ways to analyze CUR data.
Because Athena is serverless, organizations can query billing data stored in Amazon S3 using standard SQL without provisioning infrastructure.
Example questions include:
- Which AWS service generated the highest cost last month?
- What are the top 20 EC2 instances by spend?
- Which regions have the fastest-growing costs?
- Which cost centers exceeded their budgets?
- How much was spent on Amazon S3 by project?
Athena enables finance and engineering teams to answer highly specific billing questions quickly and cost-effectively.
Benefits of AWS CUR
Organizations implementing CUR gain several advantages:
Granular Cost Visibility
Understand costs at the resource, service, account, and project level.
Better Financial Reporting
Support executive dashboards, departmental reporting, and business reviews.
Accurate Cost Allocation
Allocate cloud spending across teams, products, or customers using cost allocation tags.
FinOps Enablement
Provide the detailed data needed for forecasting, optimization, and governance.
Business Intelligence Integration
Connect AWS billing data with reporting platforms such as Amazon QuickSight or external BI tools.
How to Configure AWS Cost and Usage Report
Setting up AWS Cost and Usage Report is straightforward, but proper configuration is essential for producing high-quality billing data that supports long-term financial reporting and FinOps initiatives.
The typical setup process involves several stages.
Step 1: Create a Cost and Usage Report
Within the AWS Billing and Cost Management console, create a new Cost and Usage Report.
During configuration, you'll specify:
- Report name
- Time granularity
- Data refresh settings
- Compression format
- Output format
- Amazon S3 destination
Choosing descriptive report names helps simplify reporting as organizations grow.
Step 2: Select Report Granularity
AWS CUR supports multiple reporting granularities.
Common options include:
Hourly
Provides maximum detail.
Best for:
- Enterprise analytics
- FinOps
- Cost anomaly investigations
- Engineering teams
Daily
Suitable for:
- Executive reporting
- Budget tracking
- Department reporting
Daily reports reduce storage requirements while still providing sufficient operational insight.
Step 3: Choose Output Format
AWS supports multiple output formats.
The recommended option is:
Apache Parquet
Benefits include:
- Highly compressed
- Faster Athena queries
- Lower storage costs
- Better scalability
- Optimized for analytics
Although CSV is supported in certain scenarios, Parquet is generally preferred for production reporting because it significantly reduces query time and storage costs.
Step 4: Configure Amazon S3
Reports are delivered automatically to an Amazon S3 bucket.
Best practices include:
- Dedicated billing bucket
- Versioning enabled
- Server-side encryption
- IAM access restrictions
- Lifecycle policies
- Logging enabled
A well-governed S3 bucket becomes the foundation for enterprise billing analytics.
Cost Allocation Tags
Raw billing data is valuable.
Tagged billing data is transformative.
Cost Allocation Tags allow organizations to categorize AWS resources according to business requirements.
Instead of simply seeing:
| Team | Cost |
|---|---|
| Marketing Team | $2,800 |
| Finance Team | $3,600 |
| Engineering Team | $5,600 |
| Total (Amazon EC2) | $12,000 |
This makes billing data meaningful for both finance and engineering teams.
Common Cost Allocation Tags
Organizations commonly tag resources using:
- Department
- Environment
- Team
- Application
- Customer
- Product
- Cost Center
- Project
- Business Unit
- Owner
Example:
| Key | Value |
|---|---|
| Environment | Production |
| Department | Finance |
| Project | Customer Portal |
| Owner | Platform Team |
Consistent tagging dramatically improves financial reporting accuracy.
Cost Categories
Cost Categories build upon Cost Allocation Tags by grouping AWS spending into higher-level business classifications.
Instead of analyzing thousands of individual resources, organizations can organize costs into logical categories.
Examples include:
Infrastructure
- Amazon EC2
- Amazon EBS
- Amazon VPC
Storage
- Amazon S3
- Amazon EFS
- Amazon FSx
Databases
- Amazon RDS
- Amazon DynamoDB
- Amazon Aurora
Networking
- Elastic Load Balancing
- Amazon CloudFront
- Route 53
AI & Machine Learning
- Amazon SageMaker
- Amazon Bedrock
- AWS Trainium
- AWS Inferentia
These categories simplify executive reporting and improve financial governance.
Chargeback vs Showback
Large enterprises often allocate cloud costs internally.
CUR supports two common financial models.
Showback
Showback provides visibility without requiring departments to pay directly.
Example:
| Department | Monthly AWS Spend |
|---|---|
| Engineering | $28,000 |
| Marketing | $8,000 |
| Finance | $5,000 |
Departments receive reports but are not billed separately.
Showback improves cost awareness and accountability.
Chargeback
Chargeback goes one step further.
Departments become financially responsible for their cloud usage.
Example:
| Business Unit | Internal Invoice |
|---|---|
| Business Unit A | $32,000 |
| Business Unit B | $14,000 |
Chargeback encourages responsible cloud consumption and is widely adopted in enterprise FinOps programs.
Querying CUR with Amazon Athena
Amazon Athena is one of the most powerful ways to analyze CUR.
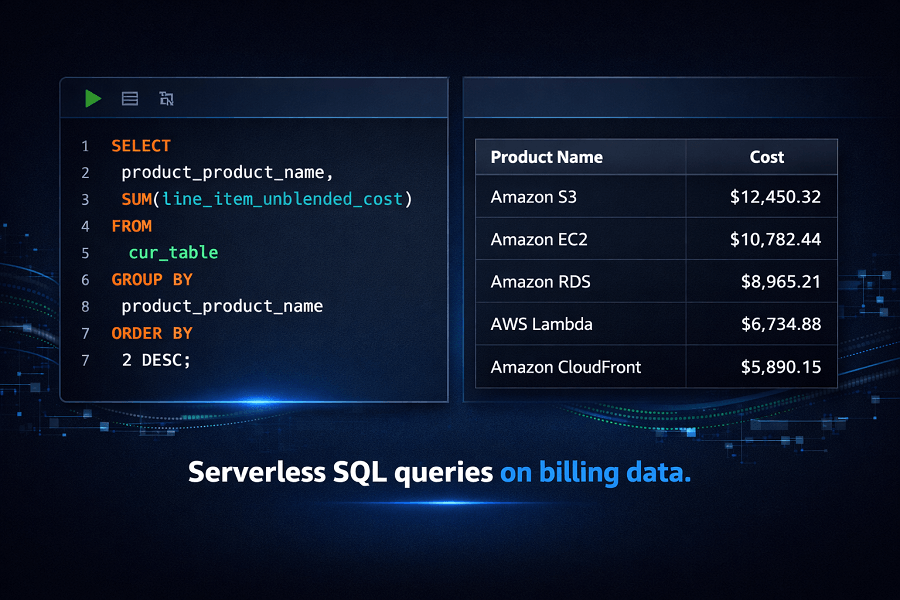
Because CUR data resides in Amazon S3, Athena enables serverless SQL queries without managing database infrastructure.
Example business questions include:
Cost by AWS Service
SELECT product_product_name,
SUM(line_item_unblended_cost)
FROM cur_table
GROUP BY product_product_name
ORDER BY 2 DESC;
This query identifies the AWS services contributing the highest costs.
Cost by Region
Organizations can analyze spending across AWS Regions to identify geographic cost patterns.
Example questions include:
- Which region has the highest compute costs?
- Which region experienced the fastest monthly growth?
- Should workloads be consolidated?
Cost by Tag
Athena can aggregate billing data by:
- Team
- Project
- Customer
- Application
- Environment
This supports both Showback and Chargeback reporting models.
Savings Plans Utilization
Organizations can query:
- Savings Plan coverage
- Effective discounts
- Remaining On-Demand costs
These reports help maximize pricing optimization investments.
Visualizing CUR with Amazon QuickSight
Raw billing data is valuable, but executives often prefer visual dashboards.
Amazon QuickSight transforms CUR into interactive business intelligence dashboards.
Common dashboard widgets include:
Monthly Cloud Spend
Track overall AWS spending trends over time.
Cost by AWS Service
Visualize spending across:
- Amazon EC2
- Amazon S3
- Amazon RDS
- AWS Lambda
- Amazon CloudFront
Cost by Department
Display cloud spending by:
- Finance
- Engineering
- Marketing
- Product
- Operations
Cost by Project
Monitor budgets for:
- Customer Portal
- Mobile Application
- AI Platform
- Data Lake
Regional Spending
Understand how cloud costs vary across AWS Regions.
Executive dashboards improve decision-making while reducing manual reporting effort.
CUR vs AWS Cost Explorer
Although both analyze cloud spending, they serve different audiences.
| AWS CUR | AWS Cost Explorer |
|---|---|
| Raw billing data | Visual dashboards |
| SQL analysis | Interactive reporting |
| Enterprise analytics | General cost analysis |
| Highly customizable | Easy to use |
| Supports BI tools | Built-in AWS interface |
| Ideal for FinOps | Ideal for operational reviews |
Cost Explorer provides quick visibility.
CUR provides complete analytical flexibility.
CUR vs AWS Budgets
These services complement one another.
| AWS CUR | AWS Budgets |
|---|---|
| Detailed billing records | Budget monitoring |
| Historical analytics | Spending alerts |
| Cost allocation | Threshold notifications |
| Chargeback | Forecasting |
| Executive reporting | Financial governance |
Organizations implementing mature cloud governance typically use both services together.
CUR vs AWS Billing Dashboard
AWS Billing Dashboard provides an overview of account spending.
CUR provides the underlying data.
| Billing Dashboard | CUR |
|---|---|
| High-level summaries | Granular records |
| Billing overview | Resource-level analytics |
| Monthly invoices | Custom reporting |
| Basic analysis | Enterprise intelligence |
Think of CUR as the data warehouse behind AWS billing.
Real-World Enterprise Reporting Example
Imagine a global SaaS company operating:
- 120 AWS accounts
- 8 business units
- 15 production environments
- Multiple AWS Regions
Leadership wants answers to questions like:
- Which department exceeded budget?
- Which product generated the highest infrastructure costs?
- Which customers consume the most AWS resources?
- Which applications should be optimized next quarter?
Using CUR:
- Billing data is stored in Amazon S3.
- AWS Glue catalogs the data.
- Amazon Athena runs SQL queries.
- Amazon QuickSight displays executive dashboards.
- Finance teams generate monthly Chargeback reports.
- Engineering teams review resource-level spending for optimization opportunities.
This workflow provides a single source of truth for cloud financial management across the organization.
Common Implementation Mistakes
Even experienced AWS teams can limit the value of CUR through poor implementation choices.
Not Enabling Cost Allocation Tags
Without consistent tagging, resource-level reporting becomes fragmented and chargeback models are difficult to implement.
Choosing CSV Instead of Parquet
CSV files consume more storage and generally result in slower analytical queries.
Parquet is better suited for large-scale reporting.
Poor S3 Governance
Billing data is sensitive.
Protect CUR buckets with:
- Least-privilege IAM policies
- Encryption
- Lifecycle rules
- Access logging
Treating CUR as an Archive
CUR should be actively queried and analyzed, not simply stored.
Organizations gain the most value when billing data supports continuous optimization, executive reporting, and AWS FinOps decision-making.
Best Practices for AWS Cost and Usage Report
Implementing CUR is only the first step. To maximize its value, organizations should follow a structured approach that ensures billing data is accurate, secure, and actionable.
1. Enable Cost Allocation Tags Early
One of the most common mistakes organizations make is enabling Cost Allocation Tags after their AWS environment has already grown.
Without consistent tagging, it becomes difficult to answer questions such as:
- Which department owns this workload?
- Which customer generated these costs?
- Which project exceeded its budget?
- Which application should be optimized?
Every production resource should include standardized tags.
Recommended tags include:
- Environment
- Department
- Project
- Application
- Team
- Owner
- Cost Center
- Customer
- Business Unit
A well-defined tagging strategy improves reporting accuracy and simplifies chargeback processes.
2. Standardize Tagging Policies
Simply creating tags is not enough.
Organizations should establish company-wide tagging standards.
For example:
| Key | Value |
|---|---|
| Environment | Production |
| Department | Engineering |
| Application | Customer Portal |
| Owner | Platform Team |
| Cost Center | CC-102 |
Standardized naming conventions reduce inconsistencies and improve the quality of financial reports.
3. Use Apache Parquet Format
Although AWS supports multiple report formats, Apache Parquet is generally the preferred option for production environments.
Advantages include:
- Smaller file sizes
- Faster SQL queries
- Lower Amazon S3 storage costs
- Better compatibility with Amazon Athena
- Improved scalability
For organizations processing millions of billing records, Parquet provides substantial performance benefits over CSV.
4. Secure Billing Data
CUR contains sensitive financial information.
Organizations should protect billing reports using AWS security best practices.
Recommended controls include:
- IAM least-privilege access
- Amazon S3 server-side encryption
- Bucket versioning
- Lifecycle policies
- AWS CloudTrail logging
- AWS Key Management Service (AWS KMS) encryption
- S3 Block Public Access
Treat CUR as confidential business data.
5. Automate Report Analysis
Downloading billing reports manually each month limits the value of CUR.
Instead, automate reporting using:
- Amazon Athena
- AWS Glue
- Amazon EventBridge
- AWS Lambda
- Amazon QuickSight
Automation enables finance and engineering teams to access updated dashboards without manual effort.
AWS Organizations and CUR
Enterprise organizations often manage dozens or even hundreds of AWS accounts.
Without centralized reporting, understanding cloud spending becomes difficult.
AWS Organizations allows CUR to consolidate billing data across linked accounts.
For example:
- Management Account
- Engineering
- Development
- Production
- Security
- Analytics
- Machine Learning
- Shared Services
Instead of generating separate reports for each account, CUR provides a unified dataset covering the entire organization.
This supports:
- Executive reporting
- Departmental reporting
- Business unit reporting
- Multi-account governance
- Enterprise cost optimization
CUR and FinOps
FinOps is built on accurate financial data.
AWS CUR serves as the primary data source for many FinOps practices.
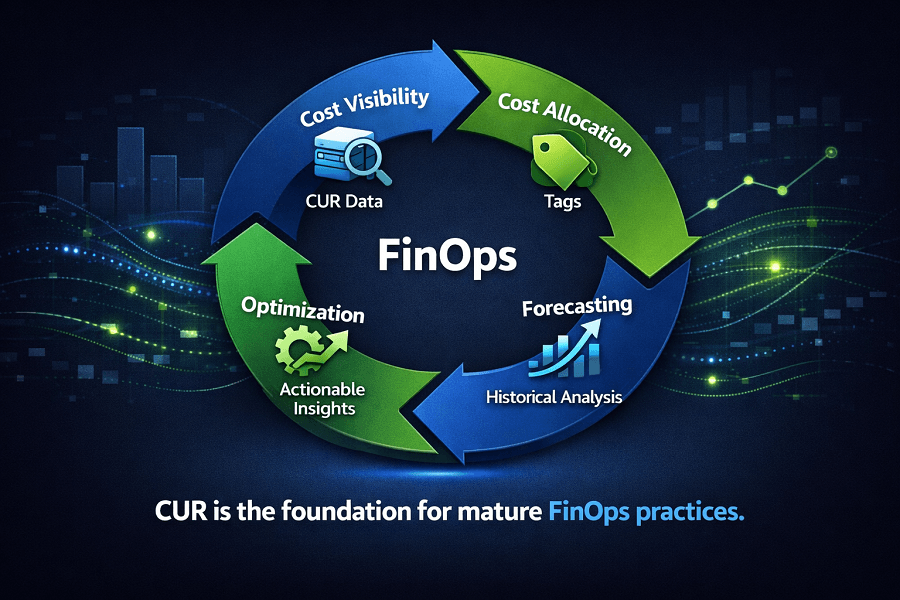
Cost Visibility
CUR provides detailed visibility into:
- Resource-level costs
- Service-level spending
- Regional usage
- Team spending
- Customer spending
This allows organizations to understand exactly where cloud budgets are being consumed.
Cost Allocation
Finance teams can allocate cloud expenses across:
- Departments
- Products
- Customers
- Business Units
- Projects
Accurate allocation improves budgeting and financial planning.
Forecasting
Historical CUR data helps organizations forecast future cloud spending.
Finance teams can identify trends such as:
- Seasonal growth
- Product expansion
- Infrastructure scaling
- Regional cost increases
This improves budget planning and reduces financial surprises.
Optimization
CUR supports continuous optimization by identifying:
- Expensive workloads
- Underused services
- High-cost regions
- Inefficient applications
- Growth patterns
Combined with AWS Cost Explorer and AWS Compute Optimizer, CUR enables data-driven optimization decisions.
Advanced Analytics with Athena
While standard reports answer many questions, Amazon Athena enables organizations to build sophisticated analyses.
Examples include:
Top 20 Most Expensive Resources
Identify the resources contributing the highest monthly costs.
Cost Trends by Environment
Analyze spending separately for:
- Production
- Development
- Testing
- Staging
Regional Cost Growth
Track monthly spending increases across AWS Regions.
This helps determine whether workloads should be consolidated or optimized.
Savings Plans Effectiveness
Measure:
- Savings Plan utilization
- Effective discounts
- Remaining On-Demand usage
- Cost avoidance
Reserved Instance Coverage
Analyze:
- Reservation utilization
- Coverage percentages
- Missed savings opportunities
These insights help maximize the value of long-term pricing commitments.
Executive Dashboards with Amazon QuickSight
Executives often need business-level summaries rather than raw billing records.
Amazon QuickSight enables organizations to create dashboards tailored to different audiences.
Executive Dashboard
Typical KPIs include:
- Monthly AWS Spend
- Budget vs Actual
- Forecasted Spend
- Cost by Business Unit
- Cost by AWS Service
- Top 10 Cost Drivers
Engineering Dashboard
Focus areas include:
- EC2 utilization
- Amazon EBS costs
- Data transfer
- Storage growth
- Compute optimization opportunities
Finance Dashboard
Typical reports include:
- Chargeback
- Showback
- Department budgets
- Cost center reports
- Forecast accuracy
Providing role-specific dashboards improves decision-making across the organization.
CUR Security and Governance
Billing data should be governed with the same care as other critical business information.
Recommended practices include:
- Encrypt data at rest using AWS KMS
- Restrict access through IAM roles
- Enable S3 access logging
- Review permissions regularly
- Apply lifecycle policies for older reports
- Audit access using AWS CloudTrail
These controls help protect financial data while supporting compliance and governance requirements.
Common Mistakes to Avoid
Organizations frequently encounter similar challenges when implementing CUR.
Inconsistent Tagging
Different naming conventions across teams reduce reporting accuracy.
Establish and enforce tagging standards early.
Ignoring Data Quality
Missing or incorrect tags lead to incomplete chargeback reports and unreliable analytics.
Regularly review tagging compliance.
Creating Too Many Dashboards
Instead of building numerous dashboards, focus on a small set of meaningful reports aligned with business objectives.
Focusing Only on Historical Data
CUR is most valuable when historical analysis informs future optimization decisions.
Use historical trends to guide budgeting, forecasting, and infrastructure improvements.
Conclusion
AWS Cost and Usage Report (CUR) is the foundation of enterprise cloud financial management. By providing detailed billing and usage data, it enables organizations to understand cloud costs at the resource, service, account, and business-unit level.
When integrated with Amazon S3, AWS Glue, Amazon Athena, and Amazon QuickSight, CUR becomes a powerful analytics platform capable of supporting executive reporting, engineering optimization, and FinOps initiatives.
However, the greatest value comes when CUR is combined with other AWS cost management services such as AWS Cost Explorer, AWS Budgets, AWS Compute Optimizer, and AWS Trusted Advisor. Together, these tools provide comprehensive visibility into cloud spending, infrastructure efficiency, and governance.
Whether you're implementing chargeback models, forecasting future costs, or building executive dashboards, CUR provides the granular data needed to make informed cloud financial decisions.
If your organization is looking to improve cost transparency, strengthen governance, or establish a mature FinOps practice, EaseCloud's AWS specialists can help you design and implement a scalable cloud financial management framework.
Frequently Asked Questions
Is AWS Cost and Usage Report free?
AWS does not charge for creating Cost and Usage Reports. However, storing reports in Amazon S3 and analyzing them with services such as Amazon Athena or Amazon QuickSight may incur charges based on usage.
How often is CUR updated?
CUR is refreshed periodically as AWS billing information becomes available. Depending on your configuration, reports may be updated multiple times throughout the day.
Can CUR replace AWS Cost Explorer?
No.
AWS Cost Explorer is designed for interactive cost analysis and visualization.
CUR provides raw billing data for advanced analytics and custom reporting.
Most organizations benefit from using both.
Does CUR include Savings Plans and Reserved Instances?
Yes.
CUR includes information about Savings Plans, Reserved Instance discounts, effective costs, and pricing details, making it suitable for analyzing pricing optimization strategies.
Can CUR support Chargeback and Showback?
Yes.
Combined with Cost Allocation Tags and Cost Categories, CUR provides the detailed financial data needed to implement both chargeback and showback models.
How EaseCloud Helps Organizations Build Cloud Financial Intelligence
As AWS environments grow, organizations often struggle to turn billing data into actionable insights. At EaseCloud, we help businesses implement end-to-end cloud financial management solutions that go beyond basic cost reporting.
Start with a Free Cloud Financial Intelligence Assessment