What's Slowing Down Your Time-to-Market and How Automation Fixes It
Identify the manual processes slowing your startup's time-to-market. Learn which automation delivers the fastest ROI and common mistakes to avoid.
TLDR;
- Delays come from hidden bottlenecks (testing, approvals, env setup, deployments) not slow coding
- Manual processes feel safe but add risk through slower feedback and larger batches
- Best ROI: CI/CD pipelines, infrastructure provisioning, monitoring
- Start right: Simplify broken processes before automating; pick tools for specific bottlenecks
Your roadmap shows clear priorities. Your team works hard. Yet features take months instead of weeks to reach customers. Somewhere between code complete and production, time disappears into manual processes, waiting, and rework.
This article examines the hidden bottlenecks that slow time-to-market and explains how strategic automation removes them. You will learn where automation delivers the highest impact, which mistakes to avoid, and how to measure results.
Why Time-to-Market Becomes a Problem as Startups Grow
Early-stage startups ship fast because their processes are simple. One engineer writes code, tests locally, and deploys directly. As teams grow, coordination overhead multiplies.
Increasing coordination overhead comes from necessary safeguards. Code reviews, security scans, compliance checks, and approval gates each add time. Individually reasonable, collectively they extend delivery cycles from days to weeks.
Fear of breaking production creates caution. Past incidents teach teams to move carefully. Deployments become events requiring scheduling, stakeholder notification, and engineer availability for immediate rollback. This caution is rational but expensive.
McKinsey's research on developer velocity found that top-quartile companies ship 4-5 times faster than bottom-quartile competitors. In European markets where regulatory compliance adds complexity, this gap often widens further.
Manual steps multiply over time. What started as one-off scripts becomes institutionalized workarounds. Each process accumulates manual interventions that made sense individually but collectively create significant delays.
What Time-to-Market Really Includes Beyond Coding
| Activity | Description | Typical Time Impact |
|---|---|---|
| Coding | Actual feature development | Only 20-30% of delivery time |
| Testing | Unit tests, integration tests, performance tests, manual QA cycles | Remaining 70-80% across testing, approvals, deployments, and post-release verification |
| Environment setup | Provisioning staging environments, configuring databases, network connectivity | Often requires days |
| Rollbacks and fixes | Recovery from production failures due to data variations, load patterns, or edge cases | Directly impacts total time-to-market |
The Manual Processes That Quietly Slow Delivery
Manual Testing and Release Checks
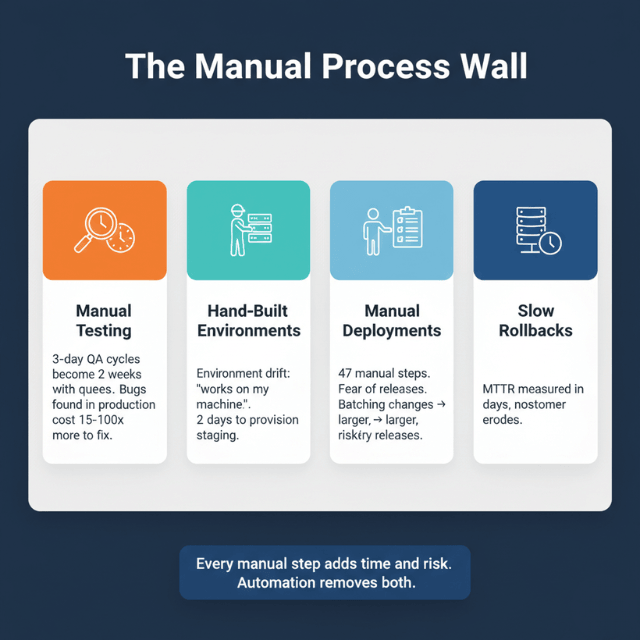
Delays waiting for validation accumulate across handoffs. When QA capacity is limited, features queue for testing. A three-day testing cycle becomes two weeks when testers handle five concurrent projects.
Human error risk increases with manual processes. IBM's research on defect costs shows that bugs found in production cost 15-100 times more to fix than bugs caught during development. Manual testing catches fewer issues than automated approaches with equivalent time investment.
Hand-Built Environments
Setup inconsistencies cause "works on my machine" problems. When staging environments differ from production, bugs appear only after release. Debugging these environment-specific issues consumes significant time.
Time wasted recreating systems compounds across projects. If provisioning a test environment takes two days, teams avoid creating them. They share environments, creating resource conflicts and testing bottlenecks.
Manual Deployments and Rollbacks
Release anxiety stems from complex deployment procedures. When releases require 47 manual steps across multiple systems, teams naturally batch changes to reduce deployment frequency. Larger releases increase risk and make problems harder to diagnose.
Longer recovery times magnify incident impact. DORA's research identifies mean time to recovery as a key performance metric. Elite performers recover in under an hour. Low performers take days or weeks, during which time customers suffer and trust erodes.
Why Manual Work Feels "Safe" but Actually Adds Risk
| Illusion of Control | Actual Risk |
|---|---|
| Human review catches obvious problems | Slower feedback loops mean problems accumulate before detection |
| Sign-offs create accountability | When testing happens weekly instead of continuously, bugs compound |
| Manual processes offer perceived safety | Larger, riskier releases result from infrequent deployments |
| Reduced release confidence creates hesitancy that compounds delays |
A defect introduced Monday might not surface until the following week's QA cycle. Accelerate research demonstrates that deployment frequency correlates inversely with change failure rate. Teams deploying daily have lower failure rates than teams deploying monthly.
When teams fear deployments, they postpone releases. Pressure builds, scope expands, and the eventual release carries more risk than smaller, frequent deployments would have.
How Automation Directly Improves Time-to-Market
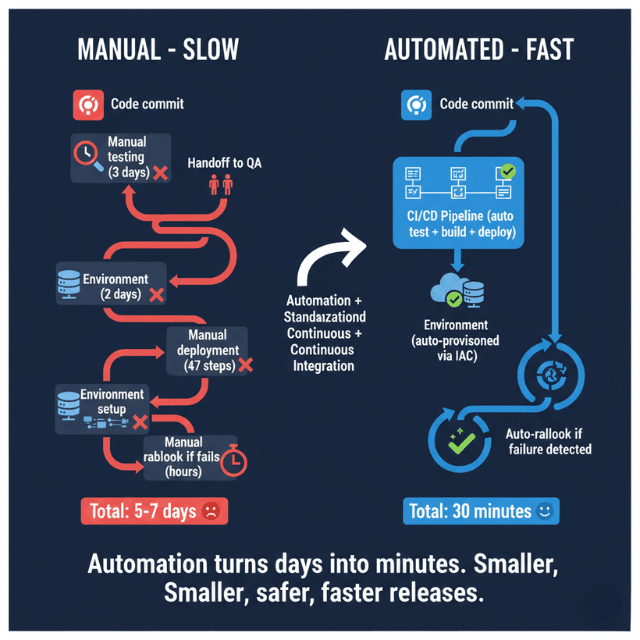
- Faster, repeatable workflows eliminate waiting: Automated tests run in minutes rather than days. Environment provisioning that took two days completes in twenty minutes. These time savings multiply across every feature.
- Smaller, safer releases become practical: When deployment takes five minutes instead of five hours, teams release individual features rather than batched changes. Smaller releases mean easier debugging when problems occur.
- Reduced dependency on individuals removes bottlenecks: Automated pipelines run independently, enabling releases whenever code is ready
Where Automation Delivers the Highest Impact First
CI/CD pipelines provide foundational automation. GitLab's 2024 DevSecOps Report found that organizations with mature CI/CD deploy 37% more frequently. Building automated build, test, and deploy pipelines typically yields the fastest ROI.
Infrastructure provisioning removes environment bottlenecks. Tools like Terraform and CloudFormation enable consistent, repeatable infrastructure. What took days of manual configuration becomes a 15-minute automated process that produces identical results every time.
Monitoring and alerts enable confident deployments. When teams trust their ability to detect problems quickly, they deploy more frequently. Automated monitoring surfaces issues before users notice, reducing incident severity and recovery time.
Common Automation Mistakes That Do Not Improve Delivery
Automating broken processes amplifies their problems. If your deployment process has 47 manual steps, automating all 47 steps creates a fragile pipeline with 47 potential failure points. Simplify first, then automate.
Over-engineering too early wastes resources. YAGNI (You Aren't Gonna Need It) applies to automation as strongly as to features. Build automation for current needs rather than anticipated future scale.
Tool-first, workflow-last thinking produces shelf-ware. Buying Kubernetes does not automatically improve deployment speed. Start by mapping your workflow, identifying bottlenecks, and selecting tools that address specific problems. Technology should serve process improvement, not the reverse.
Don't Automate Broken Processes. Fix Them First. Then Automate.
That's our approach. We don't just add tools to broken workflows.
We:
- Analyze your current delivery pipeline to find real bottlenecks
- Simplify before automating – remove unnecessary steps first
- Implement targeted automation that delivers measurable ROI
- Iterate – start simple, expand as you grow
How EaseCloud Helps Teams Automate for Faster Delivery
EaseCloud partners with European startups to implement automation that produces measurable results.
Our approach begins with:
- Delivery pipeline analysis: Identify high-friction manual steps
- Designing practical automation: Build solutions proportionate to your scale. A ten-person startup needs different automation than a hundred-person organisation
- Improving delivery speed without complexity: Resist over-engineering, focus on reliability over sophistication, ensure your team can maintain what we build
Final Takeaway: Faster Delivery Comes From Removing Friction
Automation serves as an enabler, not a shortcut. The goal is removing obstacles that slow your team, not replacing human judgment with robotic processes.
Focus on flow, not tools. Expensive software does not automatically improve delivery. Understanding where time disappears and systematically removing those delays produces results. The right tools support this effort but do not replace the analysis.
European startups competing against well-funded competitors need every advantage. Faster time-to-market means more iteration, better customer feedback, and stronger product-market fit. Automation makes this speed sustainable.
FAQs: Automation and Product Delivery Speed
Does automation always improve time-to-market?
Not automatically. Poorly implemented automation can slow delivery by adding complexity, creating new failure modes, and requiring maintenance overhead. Thoughtful automation targeting specific bottlenecks produces reliable improvements.
What should startups automate first?
Start with CI/CD pipelines covering build, test, and deploy. These provide the foundation for all other automation and typically yield the fastest return on investment. Environment provisioning and monitoring follow as natural next steps.
Can small teams benefit from automation?
Yes. Small teams benefit proportionally more because they cannot afford dedicated release engineers or extensive manual testing capacity. Simple automation allows small teams to achieve delivery capabilities that would otherwise require additional headcount.
How much automation is too much early on?
Automation becomes excessive when maintenance burden exceeds time savings, when complexity creates new failure modes, or when the team cannot understand and modify the automated systems. Start simple, measure results, and expand gradually.
How do founders measure automation impact?
Track deployment frequency, lead time, change failure rate, and mean time to recovery before and after automation implementation. These metrics quantify delivery capability improvements and correlate with business outcomes.
Summarize this post with:
Ready to put this into production?
Our engineers have deployed these architectures across 100+ client engagements — from AWS migrations to Kubernetes clusters to AI infrastructure. We turn complex cloud challenges into measurable outcomes.