Monitoring and Debugging Serverless Costs on AWS
Set up serverless cost monitoring with CloudWatch, X-Ray, Lambda Insights, and third-party tools to detect spend anomalies and cut AWS bills fast.

TLDR;
- Build CloudWatch dashboards that correlate invocations, duration, and memory with per-function cost estimates.
- Enable Lambda Insights and X-Ray to trace expensive execution paths and cold start overhead.
- Set AWS Budgets and Cost Anomaly Detection to flag spikes within 24 hours instead of waiting for month-end invoices.
- Use Datadog, Lumigo, or Thundra to attribute cost per request and surface GDPR-safe telemetry in eu-west-1.
Serverless cost optimization and monitoring is the practice of tracking, attributing, and alerting on spend across Lambda, API Gateway, DynamoDB, and Step Functions in near real time. Because AWS bills these services by millisecond, request, and event, a single misconfigured trigger can double your monthly invoice overnight.
Regional Premiums vs. us-east-1:
| Region | Premium |
|---|---|
| eu-west-1 (Ireland) | 2-8% higher |
| eu-central-1 (Frankfurt) | 2-8% higher |
According to the CNCF Annual Survey 2024, 66 percent of organisations cite observability gaps as the top barrier to serverless adoption at scale.
This guide shows how to combine native AWS tooling with targeted third-party platforms to detect, trace, and resolve serverless cost issues before they reach finance.
How Serverless Billing Generates Cost Signals
Every serverless service emits three cost-relevant signal types: invocation counts, duration metrics, and resource configuration. Lambda publishes Invocations, Duration, ConcurrentExecutions, and Throttles to CloudWatch. API Gateway emits per-stage Count, Latency, and CacheHitCount. DynamoDB reports ConsumedReadCapacityUnits and ConsumedWriteCapacityUnits. These metrics become cost-aware once you multiply them by published rates.
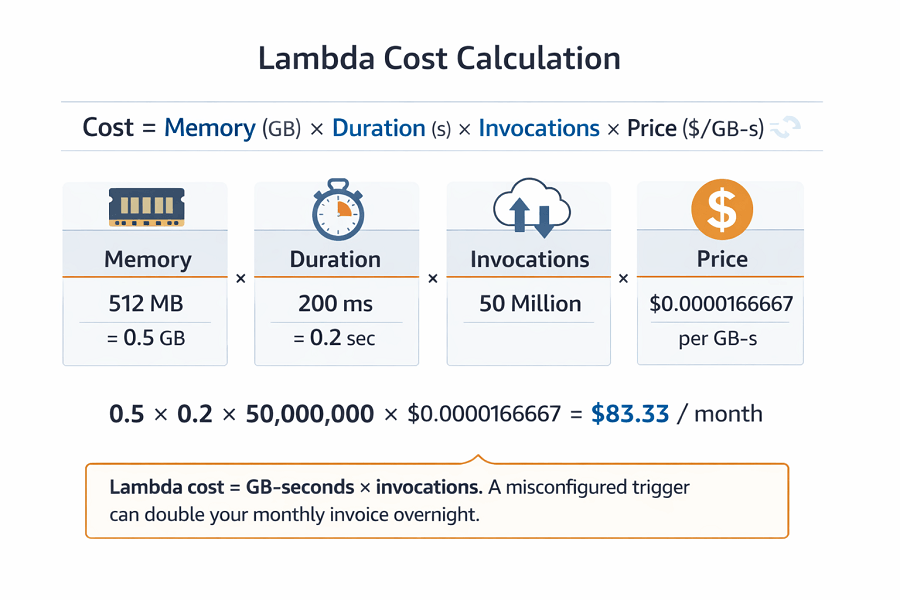
According to the AWS Lambda pricing documentation, you pay USD 0.0000166667 per GB-second in eu-west-1. Lambda cost calculation example:
| Configuration | Value |
|---|---|
| Memory | 512 MB |
| Duration per invocation | 200 ms |
| Monthly invocations | 50 million |
| Result | Becomes a line item worth reviewing weekly |
The AWS Well-Architected Serverless Lens recommends treating cost as a first-class observability signal alongside latency and errors. Cost Explorer adds a fourth dimension through resource-level tags, so applying Environment=prod and Team=checkout at deploy time is the foundation for every dashboard that follows.
Building a Cost-Aware Observability Stack
Start with a CloudWatch dashboard that computes estimated cost per function directly from emitted metrics. The metric math expression below turns raw duration and memory into a live euro figure suitable for a NOC screen.
{
  "metrics": [
    [ { "expression": "m1 * m2 * 0.0000166667 / 1000", "label": "EstCostUSD", "id": "cost" } ],
    [ "AWS/Lambda", "Duration", "FunctionName", "checkout-api", { "id": "m1", "stat": "Sum" } ],
    [ ".", "MemorySize", ".", ".", { "id": "m2", "stat": "Average" } ]
  ],
  "region": "eu-west-1",
  "title": "Checkout API estimated spend"
}
Next, activate Lambda Insights on hot functions. According to the Lambda Insights documentation, the extension adds under 1 MB of memory overhead and surfaces CPU, network, and init duration that standard CloudWatch hides. Pair it with X-Ray active tracing:
# handler.py - X-Ray annotations for cost attribution
from aws_xray_sdk.core import xray_recorder, patch_all
import boto3, json, os

patch_all()
ddb = boto3.resource("dynamodb").Table(os.environ["ORDERS_TABLE"])

def lambda_handler(event, context):
    with xray_recorder.in_subsegment("cost-tag") as seg:
        seg.put_annotation("tenant", event["headers"].get("x-tenant", "anon"))
        seg.put_annotation("region", os.environ["AWS_REGION"])
        order = ddb.get_item(Key={"id": event["pathParameters"]["id"]})
    return {"statusCode": 200, "body": json.dumps(order.get("Item", {}))}
Annotations become filterable in the X-Ray console, letting you isolate which tenant or feature flag drives the longest traces and, therefore, the highest cost. Finally, wire Cost Anomaly Detection to an SNS topic.
aws ce create-anomaly-monitor \
  --anomaly-monitor '{"MonitorName":"serverless-eu","MonitorType":"DIMENSIONAL","MonitorDimension":"SERVICE"}' \
  --region eu-west-1
According to the AWS Cost Anomaly Detection docs, the service uses machine learning to flag deviations within 24 hours and supports SNS and Slack integrations out of the box.
Debugging Cost Spikes in Practice
When a spike fires, triage in three layers.
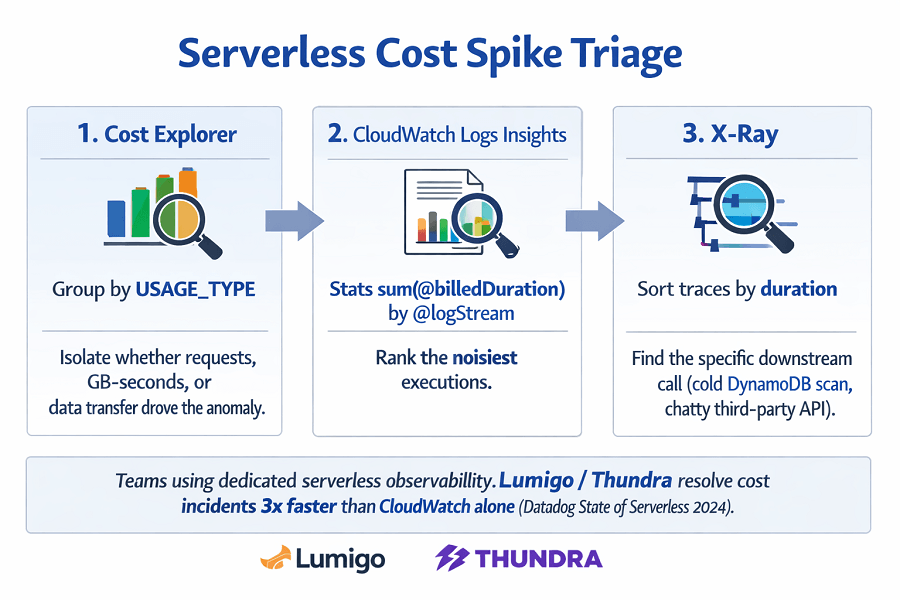
- First, open Cost Explorer and group by USAGE_TYPE to isolate whether requests, GB-seconds, or data transfer drove the anomaly.
- Second, pivot to CloudWatch Logs Insights and run stats sum(@billedDuration) by @logStream to rank the noisiest executions.
- Third, open X-Ray and sort traces by duration descending to find the specific downstream call, often a cold DynamoDB scan or a chatty third-party API, responsible for the regression.
| Tool | Features | EU Data Residency |
|---|---|---|
| CloudWatch + X-Ray | Native AWS, metric-based | ✅ (region-specific) |
| Lumigo | Cost per transaction, distributed tracing | ✅ (Frankfurt-hosted ingestion) |
| Thundra | Cost per transaction, distributed tracing | ✅ (Frankfurt-hosted ingestion) |
Teams using dedicated serverless observability resolve cost incidents 3x faster than those relying on CloudWatch alone (Datadog State of Serverless 2024)
Lumigo and Thundra attribute cost per transaction and respect EU data residency by offering Frankfurt-hosted ingestion, which matters for GDPR-sensitive payloads.
Native AWS triage or Datadog/Lumigo? We help you choose and implement the right stack.
Cost Explorer → CloudWatch Logs Insights → X-Ray: free but slower. Datadog/Lumigo/Thundra: 3x faster resolution, GDPR-ready (Frankfurt-hosted), but at additional cost.
We help you:
- Implement native AWS triage process – Group by USAGE_TYPE, rank by billedDuration, trace downstream calls
- Set up Datadog/Lumigo/Thundra – Cost per transaction, GDPR-safe telemetry in eu-west-1
- Choose based on your scale – Native for small teams, third-party for >500M invocations/month
- Resolve cost incidents 3x faster – According to Datadog State of Serverless 2024
Monitoring and Troubleshooting Tips
Keep alert fatigue low by using composite alarms that only page when both cost and error rate breach thresholds. Log retention guidelines:
| Environment | Retention Period | Cost (eu-central-1) |
|---|---|---|
| Development | 30 days | $0.03 per GB-month |
| Production | 90 days | $0.03 per GB-month |
Archive storage cost: USD 0.03 per GB-month in eu-central-1 (CloudWatch pricing page). Scrub personally identifiable information before logs leave the VPC so GDPR Article 32 requirements stay satisfied.
Finally, schedule a weekly 30-minute cost review where engineering and finance read the same dashboard. A simple ritual of ranking the top five cost regressions each Monday creates accountability without the heavy process overhead of formal FinOps ceremonies. Teams that adopt this routine tend to catch leakage within one billing cycle rather than at quarter end, which shortens the payback window on every optimization shipped.
| KPI | Purpose |
|---|---|
| Cost per active tenant | Compare tenant acquisition vs infrastructure cost growth |
| Cost per processed order | Drive pricing decisions, not only engineering work |
Layer business KPIs on top of raw cost signals. Charting cost per active tenant or cost per processed order next to Lambda spend turns abstract dollar figures into ratios executives can reason about. When tenant acquisition grows faster than infrastructure cost, the dashboard tells a story that drives pricing decisions, not only engineering work.
Conclusion
Good serverless cost monitoring blends native AWS metrics, distributed tracing, anomaly detection, and a lightweight cultural routine. Start with tagged deployments, layer in Lambda Insights and X-Ray, and close the loop with Cost Anomaly Detection wired to Slack.
Teams that treat cost as a live signal, not a monthly surprise, recover three to five percent of their serverless spend within the first quarter. If you want a partner to design GDPR-aligned dashboards and audit your Lambda Insights rollout across eu-west-1 and eu-central-1, reach out to EaseCloud for a serverless FinOps assessment tailored to European SaaS teams.
Frequently Asked Questions
How quickly can AWS Cost Anomaly Detection flag a Lambda spike?
AWS Cost Anomaly Detection vs. CloudWatch Alarms:
| Method | Detection Speed | Best For |
|---|---|---|
| AWS Cost Anomaly Detection | 24 hours (evaluates daily usage) | Budget alerts, trend analysis |
| CloudWatch metric alarms (Invocations, Duration thresholds) | < 1 minute (evaluates every minute) | Real-time spike detection |
Recommendation: Pair both, Cost Anomaly Detection for daily budget alerts, CloudWatch alarms for real-time spike detection.
Is Lambda Insights worth enabling in production for EU workloads?
Lambda Insights - Cost and Value:
| Aspect | Cost | Value |
|---|---|---|
| Per-function cost | ~$0.20/month + ingestion | Negligible for services processing millions of invocations |
| Additional metrics provided | CPU, network, init metrics | Standard CloudWatch omits these |
| Recommendation for EU workloads | Yes for hot functions | Worth enabling in production |
How do I attribute serverless cost per customer without breaking GDPR?
GDPR-Compliant Cost Attribution per Customer:
| Approach | GDPR Compliance | Implementation |
|---|---|---|
| X-Ray annotations | ✅ Use pseudonymised tenant IDs | Never raw email or personal data |
| Structured log fields | ✅ Use pseudonymised tenant IDs | Never raw email or personal data |
| Separate encrypted mapping table | ✅ Inside eu-central-1 | DynamoDB stores ID mapping separately |
| Data minimisation | ✅ Respected | Store only what's necessary |
Prohibited: Never store raw email or personal data in logs/traces.