Real-Time Monitoring for SaaS: Metrics, Dashboards & Alerting
Implement real-time monitoring for SaaS with key metrics, Prometheus/Grafana dashboards, and actionable alerting. Reduce MTTD and optimize performance proactively.

TL;DR
- Monitor percentiles (p95, p99) not averages – averages hide outlier problems.
- Alert on symptoms – error rates and latency (user impact), not internal metrics (CPU).
- Three dashboards: overview (health at glance), service-specific (debugging), correlation (CPU next to latency).
- Trace IDs in structured logs – correlate metric spikes to root cause across services.
- Prometheus + Grafana for open-source, Datadog for all-in-one managed platform.
- Reduce alert fatigue – multi-window conditions, severity tiers, delete unactionable alerts.
Real-time monitoring transforms performance management from reactive to proactive. Instead of learning about problems from users, teams see issues as they develop. Dashboards show current system health. Alerts notify teams before users experience impact. Live metrics guide optimization decisions. Effective real-time monitoring is the foundation of reliable, high-performance SaaS applications.
Why Real-Time Monitoring Matters
Problems detected early cause less damage. A slow query identified in seconds affects fewer users than one found after hours.
Mean Time to Detection (MTTD) measures how fast you find problems. Real-time monitoring minimizes MTTD. Faster detection enables faster resolution.
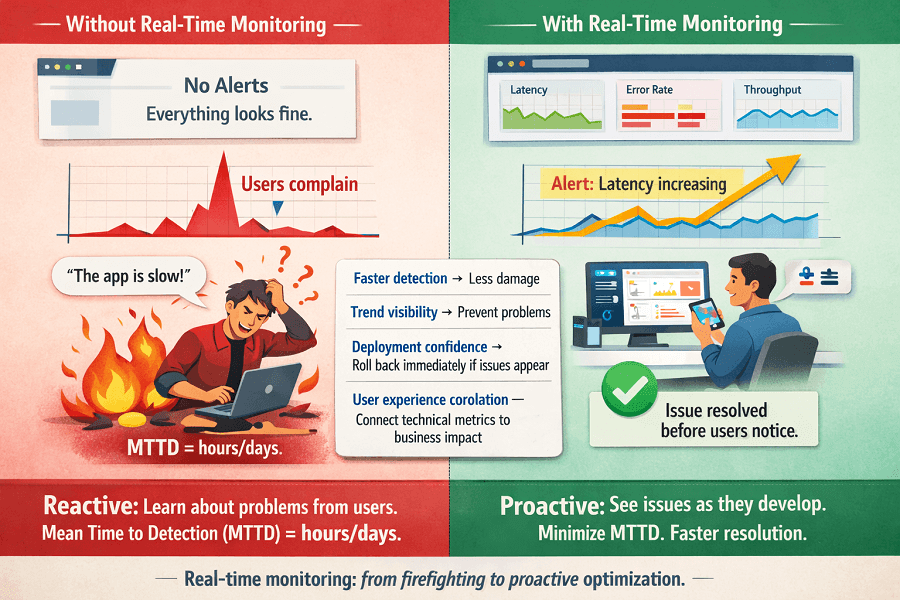
Trend visibility reveals developing issues. Gradually increasing latency becomes visible before it breaches thresholds. Teams can investigate proactively.
Capacity planning requires current data. Understanding current load informs scaling decisions. Historical averages miss current growth trajectories.
Deployment confidence increases with real-time visibility. Watch metrics during deployments. Roll back immediately if problems appear.
User experience correlation shows business impact. Connect technical metrics to user behavior. Slow checkout completion visible alongside increased latency.
Key Metrics to Monitor
Response time percentiles show the full picture. p50 shows typical experience. p95 and p99 reveal worst cases. Average hides important variation.
# Prometheus query for response time percentiles
histogram_quantile(0.95, sum(rate(http_request_duration_seconds_bucket[5m])) by (le, endpoint))
Error rates indicate system health. Total errors and errors by type. Sudden spikes demand immediate attention.
Throughput shows current load. Requests per second by endpoint. Compare to capacity limits.
Saturation reveals resource constraints. CPU utilization, memory pressure, connection pool usage. High saturation precedes problems.
Queue depths indicate backpressure. Growing queues mean processing can't keep up. Early warning of impending failures.
# Custom metric for queue monitoring
from prometheus_client import Gauge

queue_depth = Gauge('task_queue_depth', 'Number of pending tasks', ['queue_name'])

def process_queue(queue):
    queue_depth.labels(queue_name=queue.name).set(len(queue))
    # Process tasks
Database metrics track data layer health. Query times, connection usage, replication lag. Database issues cascade to applications.
External dependency health affects your system. Third-party API response times. Payment processor availability.
Monitoring Infrastructure
Metrics collection happens at multiple layers. Application instrumentation captures internal metrics. Infrastructure monitoring tracks servers and networks.
Time-series databases store metrics efficiently. Prometheus, InfluxDB, and TimescaleDB optimize for metric workloads.
# Prometheus scrape configuration
scrape_configs:
  - job_name: 'api-servers'
    scrape_interval: 15s
    static_configs:
      - targets: ['api-1:9090', 'api-2:9090', 'api-3:9090']
Agents collect system metrics. Node exporters, Datadog agents, and similar tools gather OS-level data.
Push vs pull collection models affect architecture. Prometheus pulls from targets. StatsD receives pushed metrics. Choose based on network topology.
High-availability monitoring requires redundancy. Multiple collectors prevent blind spots. Monitor the monitoring system.
Retention periods balance insight against cost. High-resolution recent data. Aggregated historical data. Tiered storage reduces costs.
Federation aggregates across clusters. Multiple Prometheus servers roll up to central monitoring. Global view from distributed collection.
Dashboard Design
Overview dashboards show system health at a glance. Key metrics for all services. Red/yellow/green status indicators.
Service-specific dashboards enable debugging. Detailed metrics for individual services. Error breakdowns and latency histograms.
// Grafana dashboard panel configuration
{
  "type": "graph",
  "title": "API Response Time",
  "targets": [{
    "expr": "histogram_quantile(0.95, sum(rate(http_request_duration_seconds_bucket[5m])) by (le))",
    "legendFormat": "p95"
  }, {
    "expr": "histogram_quantile(0.50, sum(rate(http_request_duration_seconds_bucket[5m])) by (le))",
    "legendFormat": "p50"
  }]
}
Correlation views connect related metrics. CPU usage next to response time. Database query time next to application latency.
Time range selection enables investigation. Last hour for current issues. Last week for trend analysis. Custom ranges for specific incidents.
Variable templates make dashboards reusable. Service selector applies filters across panels. One dashboard serves many services.
Annotation overlays mark events. Deployments, config changes, and incidents visible on graphs. Correlate changes with metric shifts.
Mobile-friendly dashboards enable on-call response. Key metrics visible on phones. Quick health check from anywhere.
Alerting Strategies
Alert on symptoms, not causes. Users experience errors and latency. Alert on user-facing impact first.
# Prometheus alert rules
groups:
- name: api-alerts
  rules:
  - alert: HighErrorRate
    expr: |
      sum(rate(http_requests_total{status=~"5.."}[5m])) /
      sum(rate(http_requests_total[5m])) > 0.01
    for: 5m
    labels:
      severity: critical
    annotations:
      summary: Error rate exceeds 1%
Multi-window alerts reduce false positives. Require sustained conditions before alerting. Brief spikes don't wake people up.
Severity levels guide response. Critical alerts page on-call. Warnings create tickets. Info goes to Slack.
Alert fatigue destroys effectiveness. Too many alerts means alerts get ignored. Tune thresholds based on action taken.
Escalation paths ensure response. If primary doesn't acknowledge, notify secondary. Multiple notification channels prevent missed alerts.
# PagerDuty escalation policy
escalation_policy:
  name: Production API
  escalation_rules:
    - targets:
        - type: user
          id: primary-oncall
      escalation_delay: 5
    - targets:
        - type: user
          id: secondary-oncall
      escalation_delay: 10
    - targets:
        - type: schedule
          id: engineering-managers
      escalation_delay: 15
Runbooks link from alerts. Alert message includes link to troubleshooting guide. Reduce time from alert to resolution.
Log Analysis and Correlation
Structured logging enables analysis. JSON logs with consistent fields. Query by any attribute.
import structlog

logger = structlog.get_logger()

def process_order(order):
    logger.info("processing_order",
        order_id=order.id,
        customer_id=order.customer_id,
        total=order.total,
        item_count=len(order.items))
Centralized log aggregation collects from all services. Elasticsearch, Loki, or cloud logging services store logs. Single interface for all log queries.
Trace IDs connect related logs. Request ID propagates through services. Query all logs for a single request.
# Add trace ID to all logs
@app.before_request
def add_trace_id():
    trace_id = request.headers.get('X-Trace-ID', str(uuid.uuid4()))
    g.trace_id = trace_id
    structlog.contextvars.bind_contextvars(trace_id=trace_id)
Log-metric correlation finds root causes. Spike in errors visible in metrics. Drill into logs for error details.
Pattern detection identifies anomalies. Unusual log patterns indicate problems. Alert on new error types.
Real-time log tailing for debugging. Stream logs during incident investigation. Filter to relevant services and time ranges.
Trace IDs connect logs across services. Structured logging enables analysis. We set up both.
Error rate spike at 15:32 → find trace ID of one error → {trace_id="abc123"} returns database timeout, API failure, or business logic error. Correlation turns anomaly into diagnosis.
We help you:
- Implement structured logging (JSON) – Query by any attribute, consistent fields
- Add trace IDs to all services – Propagate via HTTP headers, message queue metadata
- Set up centralized log aggregation – Elasticsearch, Loki, or cloud logging
- Enable real-time log tailing – Stream logs during incident investigation
Monitoring Tools and Platforms
Prometheus with Grafana provides open-source monitoring. Widely adopted. Extensive integration ecosystem.
Datadog offers unified observability. Metrics, traces, logs, and RUM in one platform. Commercial with extensive features.
New Relic provides application performance monitoring. Strong APM tools heritage. Good for application-centric views.
AWS CloudWatch integrates with AWS services. Native metrics from AWS resources. X-Ray for distributed tracing.
Google Cloud Operations works across GCP. Formerly Stackdriver. Integrated logging and monitoring.
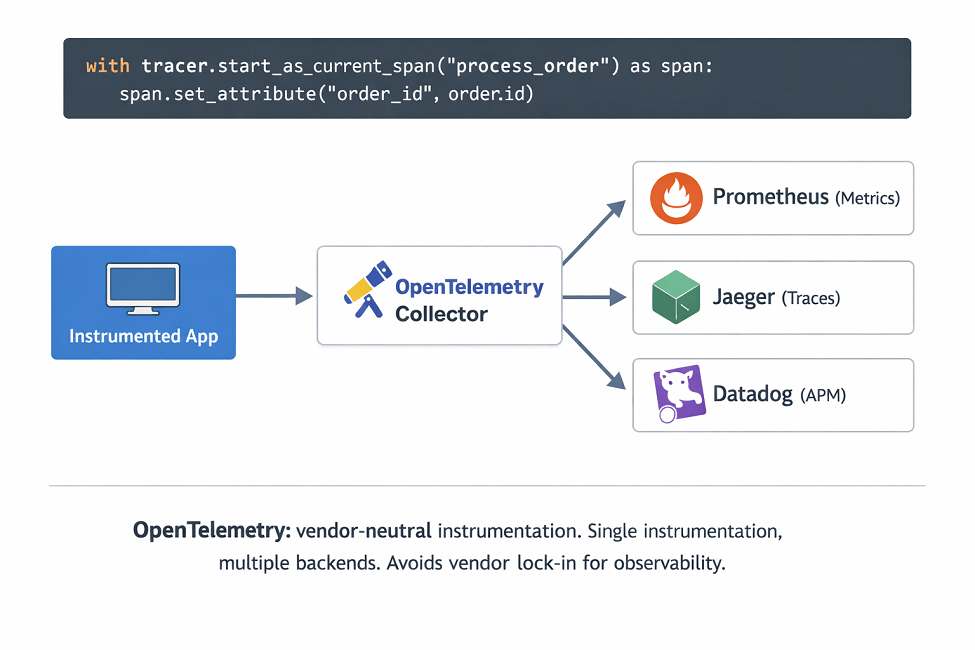
Open Telemetry provides vendor-neutral instrumentation. Single instrumentation, multiple backends. Growing adoption.
# OpenTelemetry instrumentation
from opentelemetry import trace
from opentelemetry.sdk.trace import TracerProvider
from opentelemetry.sdk.trace.export import BatchSpanProcessor

provider = TracerProvider()
processor = BatchSpanProcessor(OTLPSpanExporter())
provider.add_span_processor(processor)
trace.set_tracer_provider(provider)

tracer = trace.get_tracer(__name__)

with tracer.start_as_current_span("process_order") as span:
    span.set_attribute("order_id", order.id)
    process(order)
| Tool | Strength | Consideration |
|---|---|---|
| Prometheus/Grafana | Open source, flexible | Self-managed |
| Datadog | All-in-one platform | Cost at scale |
| New Relic | Strong APM | Can be complex |
| Cloud-native | Deep integration | Lock-in |
Conclusion
Real-time monitoring transforms performance management from reactive firefighting to proactive optimization. The three pillars:
| Pillar | Description |
|---|---|
| Metrics | Percentiles, error rates, throughput, saturation |
| Dashboards | Overview + service-specific + correlation |
| Alerting | Alert on symptoms, not causes |
Without monitoring, you're flying blind, problems reach users before you know they exist.
With proper monitoring, you see issues develop, alert before impact, and debug with logs and traces. Start with Prometheus + Grafana (open-source, flexible). Add structured logging with trace IDs. Alert on user-impacting metrics (error rate, latency SLOs). The goal is not monitoring everything, it's monitoring what matters and acting on it.
Frequently Asked Questions
1. Prometheus vs Datadog – which should I choose?
| Aspect | Prometheus + Grafana | Datadog |
|---|---|---|
| Pricing model | Open-source, self-managed, no per-metric cost | Managed, expensive at scale (per-host + per-metric) |
| Alerting | Limited built-in (Alertmanager) | Full-featured |
| Logs | Not native (add Loki) | Built-in |
| Traces | Not native (add Tempo) | Built-in |
| RUM | Not native | Built-in |
| Operations | Self-managed (requires ops capacity) | Low-ops (managed) |
| Best for | Price-sensitive teams, control, high volume | Low-ops, integrated platform, business-specific monitoring |
Many teams use both: Prometheus for high-volume metrics, Datadog for business-specific monitoring.
2. How do I reduce alert fatigue without missing real problems?
Four strategies:
- Alert on symptoms (error rate >1% for 5min) not internal metrics (CPU >80% for 2min, that's a dashboard, not a page).
- Multi-window conditions – require sustained threshold breach (e.g., 3 out of 5 evaluation periods).
- Severity tiers – critical = page, warning = ticket, info = Slack.
- Regularly review actionable alerts – if an alert fires and you take no action for a month, silence or delete it. Quality > quantity.
3. How do I correlate logs and metrics for debugging?
Log and metric correlation via trace IDs:
| Step | Action | Tool/Component |
|---|---|---|
| 1 | Generate UUID on request entry | Application code |
| 2 | Propagate through all services | HTTP headers, message queue metadata |
| 3 | Log every operation with trace ID | Structured logging |
| 4 | Detect metric spike | Prometheus (error rate spike at 15:32) |
| 5 | Find trace ID from error log sample | Log aggregator (Loki, Elasticsearch) |
| 6 | Query logs with trace ID | {trace_id="abc123"} |
| 7 | Root cause identified | Database timeout, API failure, business logic error |
Result: Correlation turns a metric anomaly into a root cause diagnosis.