How to Use APM Tools Effectively
Master Application Performance Monitoring with effective instrumentation, distributed tracing, and alerting strategies. Learn to analyze APM data and reduce MTTR with proven practices.
TL;DR
- APM = metrics + traces + logs – Use all three together.
- Auto-instrument first – Agents cover HTTP, DB, queues. Add custom tags (
order_id,customer_tier) for business context. - Use percentiles, not averages – p95/p99 reveal slow users. Averages hide problems.
- Distributed tracing – Shows cross-service bottlenecks via waterfall views and flame graphs.
- Alert on symptoms – Latency and errors (based on SLOs), not causes. Include runbooks.
- Sample intelligently – 10% of traffic, but 100% of errors.
- Best practices – Start with critical journeys, keep lightweight, standardize tags, review weekly, share access, integrate with CI/CD.
Application Performance Monitoring (APM) tools provide visibility into application behavior. They track response times, error rates, and resource consumption. They trace requests across services.
They identify bottlenecks and anomalies. But having an APM tool and using it effectively are different things. Strategic implementation and thoughtful analysis transform APM from overhead into optimization accelerator.
Understanding APM Capabilities
APM tools collect three types of data: metrics, traces, and logs. Metrics quantify system behavior over time. Traces show request flow through systems. Logs provide detailed event records.
Metrics include response times, throughput, and error rates. Aggregate metrics show trends. Percentile metrics reveal distribution.
# Custom metric reporting
from datadog import statsd

def process_order(order):
    start = time.time()
    try:
        result = do_processing(order)
        statsd.increment('orders.processed', tags=['status:success'])
        return result
    except Exception as e:
        statsd.increment('orders.processed', tags=['status:error'])
        raise
    finally:
        duration = time.time() - start
        statsd.histogram('orders.processing_time', duration)
Traces connect related operations across services. A single user request might touch dozens of services. Traces show the entire journey.
Profiling identifies where code spends time. CPU profiling shows hot functions. Memory profiling reveals allocation patterns.
Real User Monitoring (RUM) captures browser experience. Server metrics miss client-side delays. RUM shows what users actually experience.
Synthetic monitoring tests from external locations. Scheduled tests verify availability and baseline performance. Complements real user data.
Choosing the Right APM Tool
| Tool | Key Features | Best For |
|---|---|---|
| Datadog | Infrastructure, APM, logs, RUM in one platform; strong integration ecosystem | Broad monitoring coverage |
| [New Relic](https://newrelic.com/ | Mature APM capabilities; long history | Traditional and modern architectures |
| Dynatrace | AI-powered analysis; automatic root cause detection | Enterprise features |
| Elastic APM | Integrates with Elastic Stack; self-hosted option | Teams already using Elasticsearch |
| Jaeger + Prometheus | Open-source tracing + metrics | Teams with observability expertise, large scale |
APM Evaluation Criteria
- Agent overhead - Affects application performance
- Data retention - Affects investigation capability
- Cost models - Vary significantly between tools
- Stack and scale - Some tools excel with specific languages/frameworks
Some scale better than others.
# Example: Datadog agent configuration
logs_enabled: true
apm_config:
  enabled: true
  env: production
  service: order-service
process_config:
  enabled: true
Instrumentation Strategies
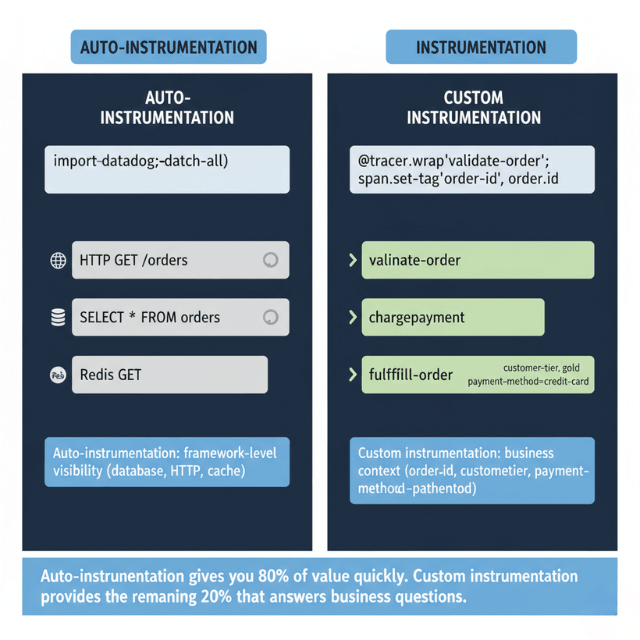
Auto-instrumentation provides immediate value. APM agents automatically instrument common frameworks. Database calls, HTTP requests, and queue operations tracked automatically.
# Automatic instrumentation with ddtrace
from ddtrace import tracer, patch_all

patch_all()  # Instruments Django, requests, psycopg2, etc.
Custom instrumentation adds business context. Track business operations, not just technical operations. Measure what matters to the business.
from ddtrace import tracer

@tracer.wrap(service='orders', resource='process_order')
def process_order(order):
    with tracer.trace('validate_order') as span:
        span.set_tag('order_id', order.id)
        span.set_tag('order_total', order.total)
        validate(order)

    with tracer.trace('charge_payment'):
        charge_payment(order)

    with tracer.trace('fulfill_order'):
        fulfill(order)
Tag traces with useful context. User IDs, tenant IDs, and feature flags enable filtering. Custom tags power analysis.
Sample strategically at scale. Tracing everything at high volume is expensive. Sample representative transactions while keeping error traces.
# Custom sampling rules
from ddtrace import tracer

tracer.configure(
    sampler=DatadogSampler(
        rules=[
            SamplingRule(sample_rate=1.0, name='error_traces'),
            SamplingRule(sample_rate=0.1, name='all_traces')
        ]
    )
)
Analyzing Performance Data
Service maps visualize dependencies. See how services connect. Identify critical paths and single points of failure.
Compare time periods to find changes. "What changed since yesterday?" is a common question. Comparison views answer quickly.
Analyze by percentiles, not averages. p50 shows typical experience. p95 and p99 show worst cases. Averages hide problems.
-- Finding slow queries in APM data
SELECT
    resource,
    count(*) as requests,
    avg(duration) as avg_duration,
    percentile(duration, 0.95) as p95_duration
FROM traces
WHERE service = 'order-service'
  AND start_time > now() - interval '1 hour'
GROUP BY resource
ORDER BY p95_duration DESC
LIMIT 10
Filter by tags to isolate issues. High latency affecting one customer? Filter by customer tag. Errors in one region? Filter by region.
Correlate metrics with traces. When latency spikes, what traces show the problem? Link aggregate views to detailed evidence.
Track trends over time. Gradual degradation is easy to miss. Weekly comparisons reveal slow regression.
Distributed Tracing
Trace context propagates across services. Each service adds its span to the trace. The full picture emerges from connected spans.
# Propagating trace context in HTTP calls
import requests
from ddtrace import tracer

def call_downstream_service(order):
    headers = {}
    tracer.inject(tracer.current_span().context, headers)

    return requests.post(
        'http://fulfillment-service/fulfill',
        json=order.to_dict(),
        headers=headers
    )
Distributed Tracing Visualization Types
| Visualization | What It Shows | Benefit |
|---|---|---|
| Waterfall views | Timing relationships between operations | Parallel ops appear side by side; sequential ops stack vertically |
| Flame graphs | Aggregate trace data across many traces | Identify common patterns and hot spots |
| Trace search | Find specific issues by tags or duration | Navigate from symptoms to evidence |
Distributed tracing across 10+ services? We make it work.
Trace context must propagate through HTTP calls, message queues, and background jobs. One missing header breaks the chain.
We help you:
- Propagate context correctly – HTTP headers, message metadata, thread-local storage
- Identify cross-service bottlenecks – Which service is really the slow one?
- Build service maps – Visualize dependencies and failure points
Alerting and Incident Response
- Alert on symptoms, not causes - Users experience latency and errors. Alert on those. Investigate causes when symptoms occur.
# Datadog alert configuration
type: metric alert
query: avg(last_5m):avg:trace.web.request.duration{service:order-service} > 500
message: |
  Order service latency exceeds 500ms.
  Check recent deployments and downstream dependencies.
  @slack-oncall
thresholds:
  critical: 500
  warning: 300
- Set meaningful thresholds - Too sensitive creates noise. Too lenient misses issues. Base thresholds on SLO targets
- Include context in alerts - Link to dashboards. Show recent changes. Provide runbook links
- Use anomaly detection - ML identifies deviations from normal; catches issues static thresholds miss
- Use alerts to trigger investigation, not panic - Good monitoring means fewer surprises
- Correlate alerts with deployments - Did this start after a deployment? Integrate APM with CI/CD
APM Best Practices
Start with the most important services. Don't instrument everything at once. Focus on critical paths first.
Keep instrumentation lightweight. Heavy agents affect the performance you're measuring. Monitor overhead.
Standardize tagging across services. Consistent tag names enable cross-service analysis. Document tagging conventions.
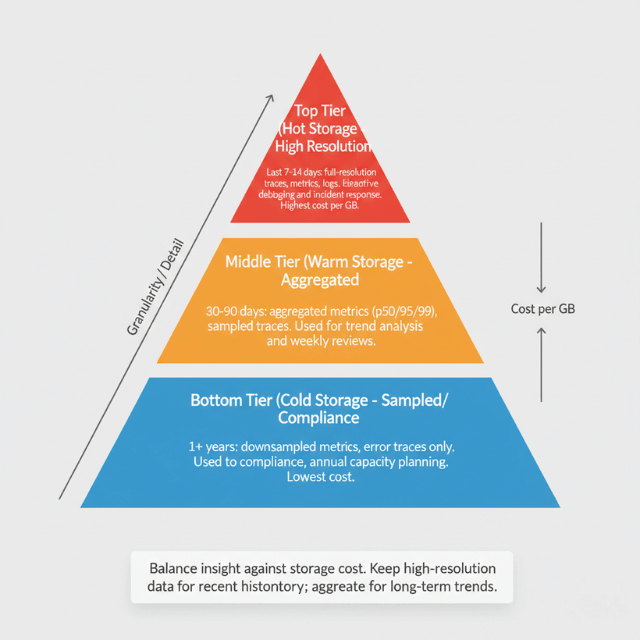
Retain data appropriately. High-resolution data for recent history. Aggregated data for longer periods. Balance insight against storage cost.
Review performance data regularly. Don't wait for alerts. Weekly performance reviews catch trends before they become problems.
Share APM access broadly. Developers should see their services' performance. Broad access improves ownership and awareness.
Integrate APM with development workflow. Link APM data to code changes. Make performance part of development, not just operations.
Train teams on APM usage. Tools are only useful when people use them effectively. Invest in training.
| Practice | Benefit |
|---|---|
| Custom instrumentation | Business context in traces |
| Percentile analysis | Visibility into worst cases |
| Trace sampling | Scale without excessive cost |
| Alert on symptoms | Actionable notifications |
| Regular review | Catch trends early |
Conclusion
APM tools are powerful, but power without strategy creates noise without insight. The difference between effective and ineffective APM lies not in the tool but in how you use it: instrument strategically (auto first, custom for business context), analyze by percentiles (averages hide problems), trace across services (distributed tracing is non-negotiable for microservices), alert on user-impacting symptoms (not internal metrics), and review data regularly (weekly performance reviews catch regressions).
- Effective APM reduces mean time to detection (MTTD) and mean time to resolution (MTTR) dramatically
- Not because the tool is magic, but because you have the data to ask the right questions when incidents occur:
- "What changed?"
- "Where is the time going?"
- "Which users are affected?"
- With proper instrumentation and analysis, these questions have answers
- Without APM, you're guessing
Invest in the tool, but invest more in the practices that make it valuable.
Frequently Asked Questions
1. What's the most common mistake when implementing APM?
Over-alerting on non-actionable metrics
- Teams often set alerts for any CPU spike or any error, generating dozens of notifications that get ignored
Fix:
- Alert only on user-impacting symptoms (latency breaching SLO, error rate exceeding threshold)
- Or on leading indicators you can actually act on (e.g., database connection pool exhaustion)
- For everything else, build dashboards and review trends weekly
- Every alert should have a clear runbook and require a human decision
- If you ignore it, delete it
2. How do I choose between open-source (Prometheus + Jaeger) and commercial APM (Datadog, New Relic, Dynatrace)?
| Aspect | Open-Source (Prometheus + Jaeger) | Commercial APM (Datadog, New Relic, Dynatrace) |
|---|---|---|
| Control | Full control | Less control |
| Licensing costs | None | Costs scale with volume |
| Operational overhead | Significant (deploy, scale, maintain) | Minimal (managed service) |
| Integration | DIY | Integrated metrics, traces, logs out-of-the-box |
| Best for | Teams with strong observability expertise, large scale (where commercial costs become prohibitive) | Most teams (time saved on operations often exceeds licensing cost) |
Recommendation: Start with commercial APM for first 1-2 years of production. When your scale makes the bill painful, evaluate open-source alternatives with dedicated SRE resources.
3. What custom instrumentation should I add beyond auto-instrumentation?
Business context tags. Auto-instrumentation gives you technical metrics (HTTP method, database query). Custom instrumentation answers business questions:
user_idorcustomer_tier→ "Is the latency only affecting free tier users?"order_totalorpayment_method→ "Is the slowdown only for large orders?"feature_flag→ "Is this related to a canary deployment?"tenant_id→ "Is one tenant experiencing errors?"
Add these tags in spans and set up dashboards to filter by them. Without business context, you know something is slow but not who is affected which delays investigation.
Summarize this post with:
