Kubernetes Auto-Scaling for Cost Savings
Reduce Kubernetes costs 40-60% with Cluster Autoscaler, Horizontal Pod Autoscaler (HPA), and Vertical Pod Autoscaler (VPA). Dynamic resource optimization for waste elimination.

TL;DR
- Three autoscalers work together: HPA scales pod replicas (CPU/custom metrics). VPA adjusts pod resource requests (prevents over-provisioning). Cluster Autoscaler adds/removes nodes.
- Use custom metrics with HPA – Scale based on pending work (queue depth), not just CPU.
- VPA "Auto" mode restarts pods – Use "Initial" or "Off" for critical workloads. Pair VPA (right-size requests) + HPA (scale replicas).
- Cluster Autoscaler – Set min/max sizes, multiple instance types (spot + on-demand), scale-down threshold (default 50%).
- Spot instances – Deliver 60-90% savings. Use disruption budgets + topology constraints.
- Resource requests are foundational – All autoscalers depend on them. Use VPA recommendations to set accurate requests.
- Common cost traps – Over-provisioned requests, no scale-down, single instance types, node fragmentation.
Kubernetes auto-scaling for cost optimization represents a critical cost optimization opportunity for cloud-native organizations. Strategic implementation of best practices can reduce expenses by 40-70% while maintaining performance and reliability. This guide explores proven strategies including resource optimization, automation, monitoring approaches, and architectural patterns that deliver measurable cost savings.
Cloud cost optimization requires systematic attention to resource provisioning, utilization monitoring, and continuous improvement processes. Organizations often discover significant waste through over-provisioned resources, idle capacity, and inefficient architectures. Modern cloud platforms provide powerful optimization tools, but successful implementation demands methodical analysis and incremental changes validated through metrics.
Understanding Cost Drivers
Primary cloud cost drivers includes:
| Cost Category | Percentage of Cloud Budget | Examples |
|---|---|---|
| Compute resources | 40-60% | EC2 instances, containers, serverless functions |
| Storage and data transfer | 20-30% | Block storage, object storage, egress fees |
| Platform services | Remainder | Load balancers, monitoring, API gateways, managed databases |
Resource over-provisioning stems from conservative capacity planning where teams allocate excess capacity without validation. Development environments often mirror production sizing despite lower requirements. Legacy migration patterns frequently perpetuate on-premises sizing without cloud-native optimization.
Hidden costs accumulate through:
- Data transfer fees
- API requests
- Monitoring overhead
- Backup storage
These seemingly minor expenses compound at scale, potentially representing 15-25% of total cloud spending for large deployments.
Optimization Strategies
Right-sizing resources prevents wasteful over-provisioning by matching instance types and sizes to actual workload requirements. Analyze utilization metrics over representative periods identifying instances running below 40% average utilization. These represent downsizing opportunities where smaller configurations maintain adequate performance.
Automated scaling adjusts capacity dynamically based on demand, eliminating idle resources during low-traffic periods while maintaining performance during peaks. Configure auto-scaling policies with:
- Configure with appropriate thresholds
- Set proper cooldown periods
- Define scaling increments that prevent both resource waste and performance degradation
Reserved Capacity vs. On-Demand vs. Spot
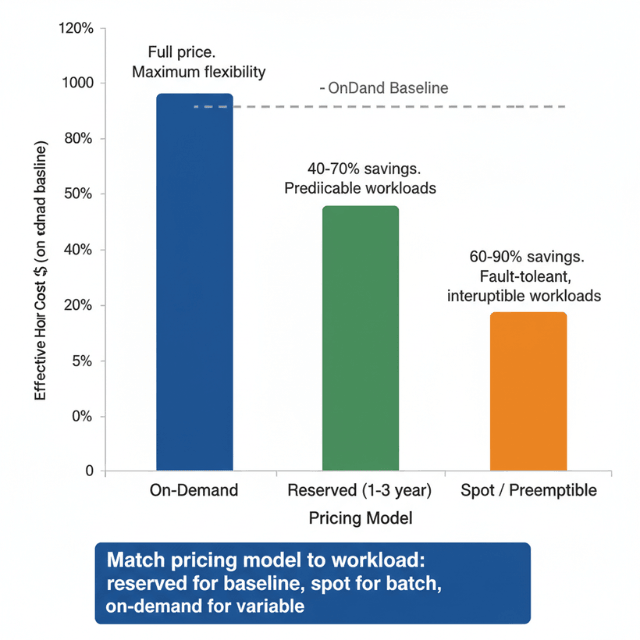
| Pricing Model | Discount Range | Best For |
|---|---|---|
| Reserved capacity / Savings plans | 40-70% | Predictable baseline workloads |
| On-demand | 0% discount (full price) | Variable load, unpredictable traffic |
| Spot instances | Varies (can be 60-90% off) | Fault-tolerant, interruptible workloads |
Combine reserved capacity for baseline with on-demand or spot for variable load maximizing savings while maintaining flexibility.
These Strategies Work. Implementing Them Correctly Is the Challenge.
Right-sizing, auto-scaling, and reserved capacity sound straightforward. But getting them right requires:
- Utilization analysis – Identifying genuine waste vs. necessary headroom
- Auto-scaling tuning – Avoiding thrashing and premature scaling
- Reserved capacity planning – Balancing commitment discounts with flexibility
- Spot instance strategies – 60-90% discounts without reliability tradeoffs
We've helped startups reduce cloud costs by 40-70% using these exact strategies.
Implementation Best Practices
Systematic review processes enable continuous optimization. Schedule quarterly assessments analyzing cost trends, utilization patterns, and optimization recommendations. Monthly spot-checks of highest-cost resources catch obvious inefficiencies early.
- Enable accurate cost allocation by project, team, environment, or customer
- Implement consistent tagging policies enforced through automation
- Tag-based cost reports provide visibility into spending patterns
- Supports optimization prioritization and accountability
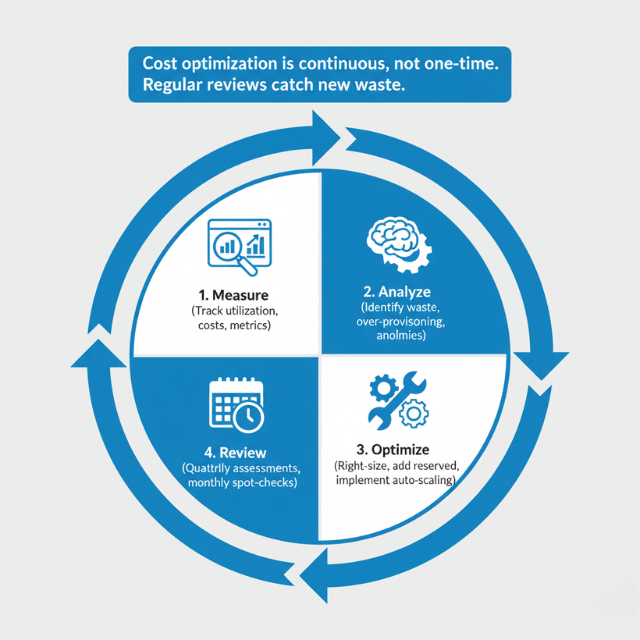
Monitoring and alerting catch cost anomalies before significant budget impact. Configure budget thresholds with automated alerts at 80%, 90%, and 100% of planned spending. Anomaly detection identifies unusual patterns indicating configuration errors or unexpected usage growth.
| Threshold | Purpose |
|---|---|
| 80% of planned spending | Early warning - approaching budget limit |
| 90% of planned spending | Action required - review spending patterns |
| 100% of planned spending | Budget exceeded - immediate investigation needed |
Monitoring and Metrics
Key Performance Indicators to Track
| Metric | Purpose |
|---|---|
| Total monthly cloud spending | Overall cost baseline |
| Cost per transaction or user | Unit economics normalization |
| Resource utilization percentages | Identify optimization candidates |
| Waste identified through optimization reviews | Measure improvement progress |
Establish baseline metrics enabling measurement of optimization progress over time.
Cost per unit metrics normalize spending against business outcomes:
- Cost per customer
- Cost per transaction
- Cost per API call
- Cost per other relevant unit economics
This reveals whether cost growth aligns with business value or represents inefficiency requiring optimization.
Utilization dashboards visualize resource consumption across compute, storage, and platform services. Highlight under-utilized resources as optimization candidates. Track utilization trends ensuring optimizations don't overcorrect causing performance issues.
Conclusion
Effective cost optimization balances expense reduction against performance, reliability, and agility requirements. Systematic approaches achieve 40-70% savings through right-sizing, automated scaling, commitment-based discounts, and architectural improvements. Implement regular review cycles, comprehensive monitoring, and gradual changes validated through metrics.
Success requires ongoing discipline rather than one-time optimization projects, with continuous monitoring catching new inefficiencies as workloads evolve. Establish cost awareness as part of engineering culture where optimization considerations inform architectural decisions alongside functionality and performance requirements.
Frequently Asked Questions
How much cost reduction is realistic through optimization?
| Scenario | Expected Savings |
|---|---|
| Most organizations through systematic optimization | 40-60% reduction |
| Poorly optimized environments | Greater improvement potential |
| Even well-managed clouds | Typically 20-30% savings through continuous optimization |
How often should I review and optimize cloud costs?
Conduct detailed quarterly reviews analyzing trends, utilization patterns, and optimization recommendations. Implement monthly spot-checks of highest-cost resources. Establish automated monitoring and alerting for continuous anomaly detection between formal review cycles.
What metrics should I track to measure optimization success?
Optimization Success Metrics:
- Total monthly cloud spending
- Cost per business unit (transaction, user, customer)
- Resource utilization percentages
- Savings realized from optimization initiatives
- Trends over time validating sustained cost reduction without performance degradation
Summarize this post with: