Node.js Performance Optimization with Event Loop, Clustering, and Caching
Optimize Node.js SaaS apps with event loop best practices, clustering for multi-core CPU, Redis caching, memory management, and production profiling tools like Clinic.js.

TL;DR
- Event loop must never block. Sync file reads, heavy CPU work, and long loops freeze all requests. Use async APIs (
fs.promises), offload CPU to worker threads, and chunk large arrays withsetImmediate. - Clustering utilizes all CPU cores. Node.js single-thread leaves cores idle. Use
clustermodule or PM2 (pm2 start app.js -i max). Requires stateless design – move sessions and caches to Redis. - Redis caching > in-memory.
node-cacheworks per worker but not shared.ioredisprovides shared cache across processes and servers, plus persistence and pub/sub. - Monitor event loop lag, heap usage, and active handles. Use Clinic.js for profiling (
clinic doctor -- node app.js). SetNODE_ENV=productionfor framework optimizations. - Common fixes:
Promise.all()for parallel I/O, stream large files (avoidfs.readFileSync), set heap limits (--max-old-space-size=4096), and implement graceful shutdown for zero-downtime deploys.
Node.js powers many high-performance SaaS applications with its non-blocking I/O model. However, achieving optimal performance requires understanding Node.js-specific patterns. The event loop, single-threaded architecture, and V8 engine characteristics all influence how you optimize Node.js applications.
Understanding the Node.js Event Loop
The event loop is Node.js is core mechanism for handling concurrency. Unlike multi-threaded servers, Node.js processes all JavaScript in a single thread. The event loop cycles through phases, executing callbacks when asynchronous operations complete.
This model excels at I/O-bound workloads. While waiting for database queries, file reads, or network responses, Node.js processes other work. High concurrency is achievable without thread management overhead.
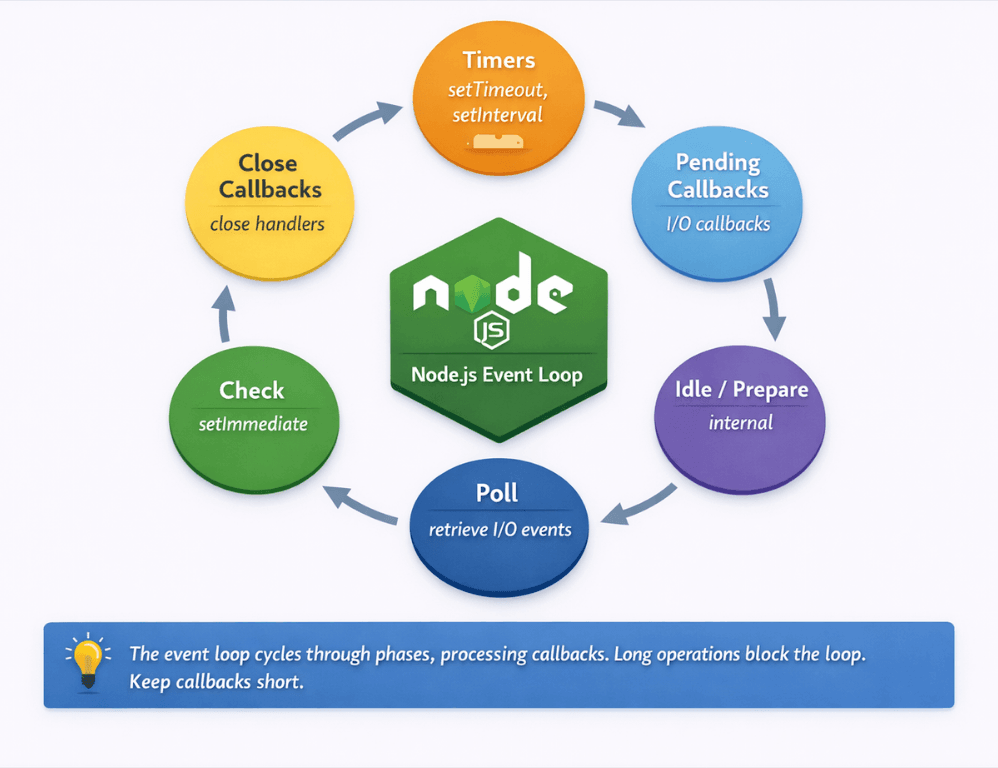
The event loop operates in phases: timers, pending callbacks, idle/prepare, poll, check, and close callbacks. Understanding these phases helps explain behavior in complex applications.
| Phase | Purpose |
|---|---|
| Timers | Executes setTimeout and setInterval callbacks |
| Pending callbacks | Executes I/O callbacks deferred to next loop |
| Idle/prepare | Internal use only |
| Poll | Retrieves new I/O events; executes I/O callbacks |
| Check | Executes setImmediate callbacks |
| Close callbacks | Executes close event handlers |
Blocking the event loop degrades performance for all requests. When synchronous code runs, nothing else can process. A single slow synchronous operation affects every concurrent user.
Asynchronous patterns keep the event loop free. Callbacks, Promises, and async/await allow Node.js to process other work while waiting for operations to complete.
// Blocking: prevents event loop from processing other work
const data = fs.readFileSync('/large-file.json');

// Non-blocking: event loop continues while file reads
const data = await fs.promises.readFile('/large-file.json');
The event loop is optimized for short, frequent operations. Long-running computations break this model. Design applications around quick callback execution.
Avoiding Event Loop Blocking
Synchronous file operations block the event loop. Use async versions: fs.promises.readFile instead of fs.readFileSync. This pattern applies to all I/O operations.
CPU-intensive operations block the event loop. JSON parsing large files, complex calculations, and cryptographic operations can freeze the server. Offload these to worker threads.
const { Worker } = require('worker_threads');

function runHeavyTask(data) {
    return new Promise((resolve, reject) => {
        const worker = new Worker('./heavy-task.js', { workerData: data });
        worker.on('message', resolve);
        worker.on('error', reject);
    });
}

// heavy-task.js
const { workerData, parentPort } = require('worker_threads');
const result = performHeavyComputation(workerData);
parentPort.postMessage(result);
Long-running loops block execution. Process large arrays in chunks using setImmediate or process.nextTick to yield to the event loop between batches.
async function processLargeArray(items) {
    const chunkSize = 100;
    for (let i = 0; i < items.length; i += chunkSize) {
        const chunk = items.slice(i, i + chunkSize);
        chunk.forEach(processItem);

        // Yield to event loop between chunks
        await new Promise(resolve => setImmediate(resolve));
    }
}
Monitor event loop lag. Metrics like libuv event loop delay reveal blocking problems. Alert when lag exceeds acceptable thresholds.
Use Promise.all for parallel operations. Independent async operations should run concurrently, not sequentially.
// Sequential (slow)
const user = await getUser(id);
const orders = await getOrders(id);

// Parallel (faster)
const [user, orders] = await Promise.all([
    getUser(id),
    getOrders(id)
]);
Clustering for Multi-Core Utilization
Node.js runs JavaScript in a single thread. On multi-core servers, this leaves CPU cores idle. Clustering runs multiple Node.js processes to utilize all cores.
The cluster module creates worker processes that share server ports. The master process distributes connections across workers.
const cluster = require('cluster');
const os = require('os');

if (cluster.isMaster) {
    const numCPUs = os.cpus().length;

    for (let i = 0; i < numCPUs; i++) {
        cluster.fork();
    }

    cluster.on('exit', (worker) => {
        console.log(`Worker ${worker.process.pid} died, restarting...`);
        cluster.fork();
    });
} else {
    // Worker process: run the application
    require('./app');
}
PM2 simplifies clustering. This process manager handles cluster mode, automatic restarts, and monitoring without modifying application code.
# Start application with cluster mode
pm2 start app.js -i max  # max = number of CPU cores
Clustering requires stateless design. Workers don't share memory. Session data, caches, and other state must move to external storage like Redis.
Load distribution varies by connection type. Short HTTP requests distribute evenly. WebSocket connections may create uneven distribution since connections persist.
Worker processes can restart independently. This enables zero-downtime deployments and automatic recovery from crashes.
Clustering unlocks multi-core performance. We build stateless applications that leverage it.
PM2 makes clustering easy. But clustering only helps if your application is stateless – sessions, caches, and state must move to external storage like Redis.
Our cloud-native development teams help you:
- Design stateless Node.js applications – Any instance handles any request
- Implement external session storage – Redis or database for session persistence
- Configure PM2 clustering –
pm2 start app.js -i maxwith zero downtime - Handle worker failures gracefully – Automatic restarts, health checks
Effective Caching Strategies
In-memory caching provides fastest access. Libraries like node-cache store data in process memory. Best for frequently accessed, relatively small datasets.
const NodeCache = require('node-cache');
const cache = new NodeCache({ stdTTL: 300 }); // 5 minute default TTL

async function getUser(id) {
    const cacheKey = `user:${id}`;
    const cached = cache.get(cacheKey);
    if (cached) return cached;

    const user = await database.findUser(id);
    cache.set(cacheKey, user);
    return user;
}
In-memory caches don't survive restarts. They also don't share between cluster workers. Use for non-critical caching or as a first tier before external caches.
Redis provides shared caching across processes and servers. ioredis is the recommended client for Node.js applications.
const Redis = require('ioredis');
const redis = new Redis();

async function getUser(id) {
    const cacheKey = `user:${id}`;
    const cached = await redis.get(cacheKey);
    if (cached) return JSON.parse(cached);

    const user = await database.findUser(id);
    await redis.setex(cacheKey, 300, JSON.stringify(user));
    return user;
}
Cache HTTP responses for expensive endpoints. Response caching at the application level or with CDN reduces backend processing.
Database query caching reduces database load. Cache query results with keys based on query parameters.
Implement cache warming on startup. Pre-populating caches with commonly accessed data prevents cold-start performance degradation.
Memory Management
V8's garbage collector manages memory automatically, but you can influence its behavior. Understanding memory management helps avoid performance problems.
Monitor heap usage. Process.memoryUsage() provides heap statistics. Track trends over time to identify leaks.
// Log memory usage periodically
setInterval(() => {
    const usage = process.memoryUsage();
    console.log({
        heapUsed: Math.round(usage.heapUsed / 1024 / 1024) + 'MB',
        heapTotal: Math.round(usage.heapTotal / 1024 / 1024) + 'MB'
    });
}, 60000);
Memory leaks accumulate over time. Common causes include event listeners not removed, closures capturing large objects, and growing caches without size limits.
Configure heap size appropriately. By default, V8 limits heap size. For memory-intensive applications, increase with --max-old-space-size.
node --max-old-space-size=4096 app.js # 4GB heap limit
Profile heap usage for leak detection. Chrome DevTools can connect to Node.js processes for heap snapshots and profiling.
Stream large files instead of loading into memory. Streaming processes data in chunks without consuming memory proportional to file size.
Profiling and Monitoring
Clinic.js provides comprehensive Node.js profiling. Doctor diagnoses general issues. Bubbleprof visualizes async operations. Flame generates flame graphs.
npx clinic doctor -- node app.js
npx clinic flame -- node app.js
The built-in profiler generates V8 profiles. Chrome DevTools can analyze the resulting profiles.
node --prof app.js
node --prof-process isolate-*.log > processed.txt
Application Performance Monitoring (APM) tools provide production visibility. Datadog, New Relic, and similar tools instrument Node.js applications.
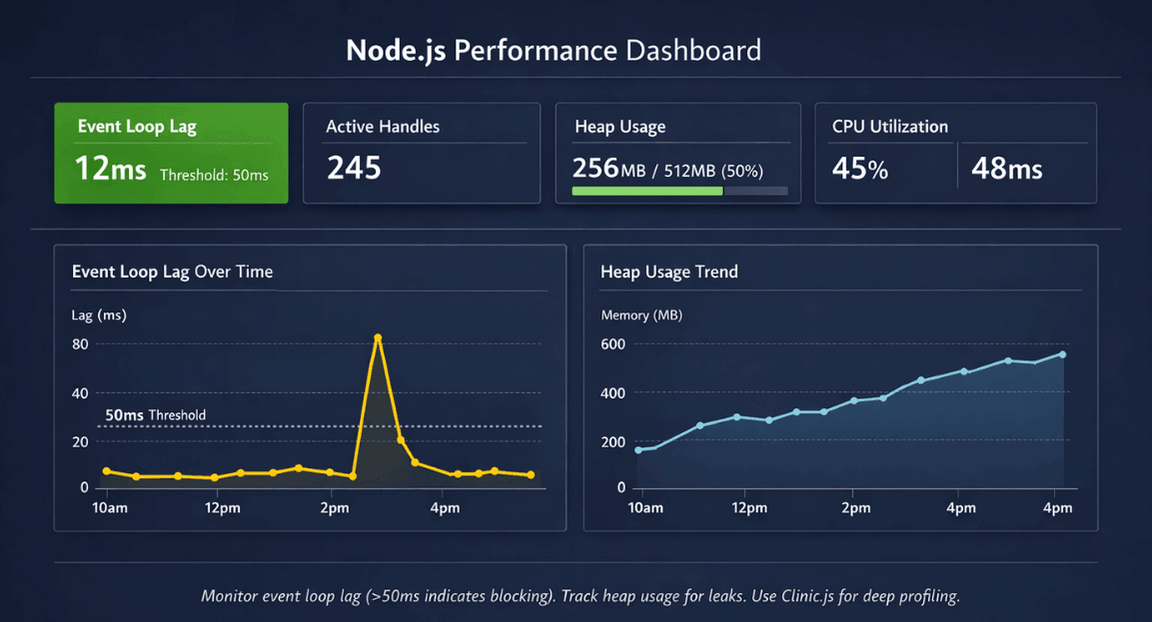
Monitor key Node.js metrics: event loop lag, active handles, heap usage, and CPU utilization. These metrics reveal performance characteristics.
Trace async operations for bottleneck identification. Async hooks and distributed tracing reveal where time is spent across async boundaries.
Production Best Practices
Use process managers like PM2 for production. They handle clustering, automatic restarts, log management, and graceful reloads.
Enable production mode in frameworks. Express and other frameworks have production optimizations disabled by default.
NODE_ENV=production node app.js
Implement graceful shutdown. Handle SIGTERM to finish in-flight requests before exiting. This enables zero-downtime deployments.
process.on('SIGTERM', () => {
    console.log('SIGTERM received, shutting down gracefully');
    server.close(() => {
        console.log('HTTP server closed');
        process.exit(0);
    });
});
Keep Node.js updated. Performance improvements and security patches appear in each release. LTS versions provide stability with regular updates.
Set appropriate timeouts. Prevent hung connections from consuming resources indefinitely.
Use compression for responses. Enable gzip or brotli compression to reduce bandwidth.
Conclusion
Node.js shines for I/O-heavy SaaS applications, but only when you respect its architecture. Key optimization principles:
- The event loop demands non-blocking patterns
- Offload CPU work to worker threads
- Use
setImmediatefor large batches - Never use sync I/O in production
- Clustering unlocks multi-core performance (PM2 makes it trivial)
- Redis provides shared caching across workers
- Profiling tools (Clinic.js) reveal hidden bottlenecks
With these patterns, Node.js handles thousands of concurrent connections on modest hardware. Without them, even low traffic can freeze the entire server.
FAQs
1. When should I use worker threads vs clustering?
Worker threads for CPU-intensive work within a single process (e.g., image processing, heavy calculations, PDF generation). They share memory but don't block the event loop. Clustering for scaling across CPU cores multiple independent Node.js processes, each handling its own event loop. Use both: cluster for horizontal scaling, worker threads within each cluster worker for CPU tasks.
2. How do I detect event loop blocking in production?
Monitor event loop lag. Use the perf_hooks module: measure time between setTimeout calls. Popular APM tools (Datadog, New Relic) expose this metric automatically. Alert when lag > 50ms. Clinic.js reveals what code causes blocking during load testing.
| Method | Tool/Module | Alert Threshold | Purpose |
|---|---|---|---|
| Event loop lag | perf_hooks module |
> 50ms | Production monitoring |
| APM metrics | Datadog, New Relic | Automatic | Real-time alerting |
| Load testing | Clinic.js | N/A | Identify blocking code |
3. When should I avoid in-memory caching?
Never use in-memory caching (node-cache) when:
| Scenario | Why Avoid | Alternative |
|---|---|---|
| Running clustered | Caches are not shared across workers | Redis |
| After deployments | Cache resets on restart | Redis |
| Data must survive process restarts | In-memory only | Redis |
| Across multiple servers | No synchronization | Redis |
Use Redis for production. Reserve node-cache for ephemeral, non-critical, single-process scenarios like dev environments.
Summarize this post with:
Ready to put this into production?
Our engineers have deployed these architectures across 100+ client engagements — from AWS migrations to Kubernetes clusters to AI infrastructure. We turn complex cloud challenges into measurable outcomes.