Monitor LLM Performance with Azure Insights
Learn how to monitor production LLM deployments on Azure using Azure Monitor, Log Analytics, and Application Insights to detect issues faster, reduce downtime, track GPU and latency metrics, and maintain reliable, high-performance AI services at scale.
TLDR;
- Complete monitoring reduces downtime by 75% and resolves issues 65% faster
- Log Analytics queries identify slowest requests, error patterns, and GPU trends
- Application Insights provides distributed tracing across tokenization, inference, and decoding
- Budget alerts notify teams when spending exceeds 80% of monthly threshold
Production LLM deployments require robust monitoring to maintain reliability and performance: latency spikes hurt user experience, error rates climb without warning, and GPU memory leaks crash instances outright. Without proactive monitoring, you only discover these problems once users complain and the business impact has already accumulated.
Azure Monitor provides end-to-end observability built specifically for Azure ML and AKS deployments: it tracks performance metrics automatically collected from managed endpoints, monitors custom application metrics that matter to your business, and centralizes logs with Log Analytics for troubleshooting.
Use Application Insights for distributed tracing across services, set up real-time alerting with action groups that notify teams immediately, and rely on built-in dashboards and workbooks to visualize system health at a glance.
Essential capabilities includes:
| Capability | Purpose |
|---|---|
| Automatic metric collection | Endpoint performance without instrumentation |
| Custom application metrics | Business-specific KPIs |
| Log Analytics queries | Powerful troubleshooting |
| Application Insights tracing | Distributed request tracing |
| Alert rules with thresholds | Proactive notification |
| Actionable dashboards | System health visualization |
This guide covers integration points including Azure ML endpoints, AKS clusters, Container Apps, GPU metrics, application telemetry, and cost tracking. Organizations implementing these monitoring patterns detect issues 80% faster, reduce mean time to resolution by 65%, and achieve 99.9% uptime for production LLM services.
Metrics Collection and Configuration
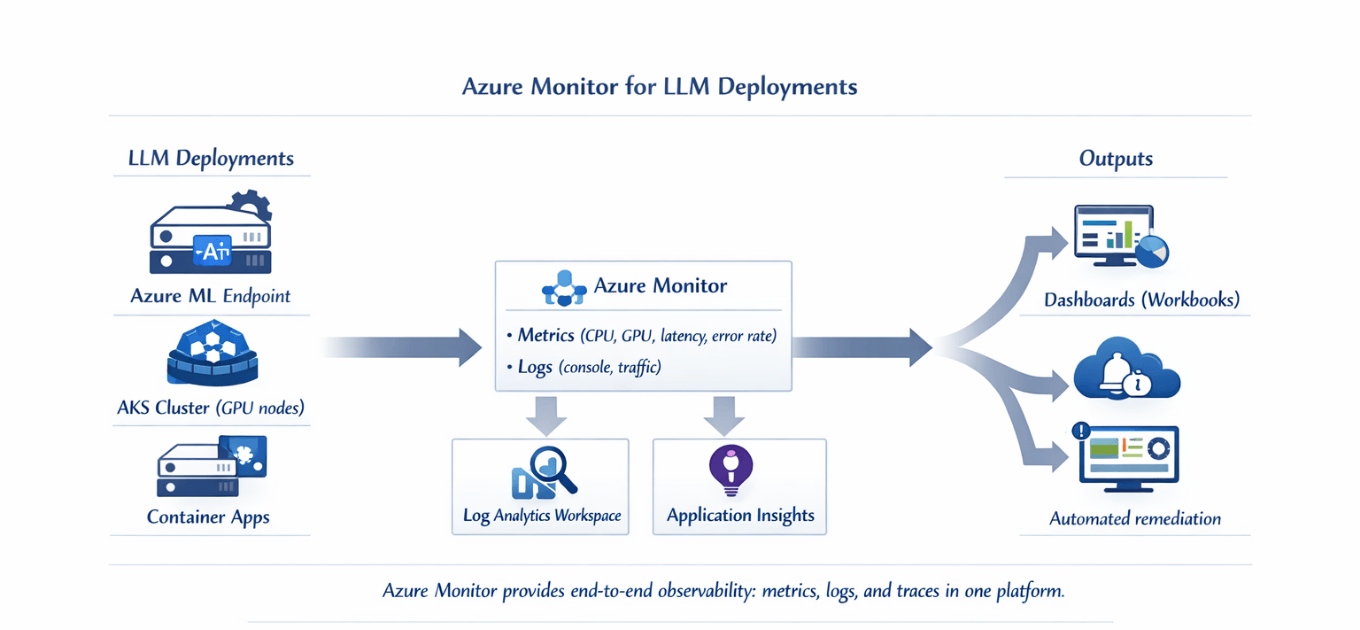
Azure Monitor automatically collects metrics from Azure ML managed endpoints and AKS clusters. Enable diagnostic settings to capture detailed telemetry.
from azure.ai.ml import MLClient
from azure.identity import DefaultAzureCredential

ml_client = MLClient(
    DefaultAzureCredential(),
    subscription_id="your-subscription-id",
    resource_group_name="your-resource-group",
    workspace_name="your-workspace"
)

# Enable diagnostic settings
diagnostic_config = {
    "logs": [
        {
            "category": "AmlOnlineEndpointTrafficLog",
            "enabled": True
        },
        {
            "category": "AmlOnlineEndpointConsoleLog",
            "enabled": True
        }
    ],
    "metrics": [
        {
            "category": "AllMetrics",
            "enabled": True
        }
    ],
    "workspaceId": "/subscriptions/.../workspaces/ml-logs"
}
Built-in endpoint metrics includes:
| Metric | What It Measures |
|---|---|
| RequestLatency | End-to-end request duration |
| RequestsPerMinute | Traffic volume |
| RequestHttpStatusCode | Success and error rates |
| CpuUtilization | CPU usage percentage |
| MemoryUtilization | Memory usage percentage |
| GpuUtilization | GPU usage percentage (when applicable) |
Track business-specific metrics with custom instrumentation:
from opencensus.ext.azure import metrics_exporter
from opencensus.stats import aggregation, measure, stats, view

# Setup Azure Monitor exporter
exporter = metrics_exporter.new_metrics_exporter(
    connection_string="InstrumentationKey=your-key"
)

# Define custom metrics
tokens_generated = measure.MeasureInt(
    "tokens_generated",
    "Number of tokens generated",
    "tokens"
)

quality_score = measure.MeasureFloat(
    "quality_score",
    "Response quality score",
    "score"
)

# Create views and register
stats_recorder = stats.Stats().stats_recorder
view_manager = stats.Stats().view_manager

tokens_view = view.View(
    "tokens_generated_view",
    "Total tokens generated",
    ["model", "environment"],
    tokens_generated,
    aggregation.LastValueAggregation()
)

view_manager.register_view(tokens_view)
view_manager.register_exporter(exporter)

# Record metrics
def track_inference(model_name, tokens, quality):
    mmap = stats_recorder.new_measurement_map()
    tmap = {"model": model_name, "environment": "production"}
    mmap.measure_int_put(tokens_generated, tokens)
    mmap.measure_float_put(quality_score, quality)
    mmap.record(tmap)
Monitor GPU utilization in AKS deployments:
InsightsMetrics
| where Namespace == "container.azm.ms/gpu"
| where Name == "gpu_utilization"
| summarize avg(Val) by bin(TimeGenerated, 5m), Computer
| render timechart
Dashboards and Visualization
Create dashboards that visualize key metrics for quick health assessment.
Azure Workbook for LLM monitoring:
{
  "version": "Notebook/1.0",
  "items": [
    {
      "type": 3,
      "content": {
        "version": "KqlItem/1.0",
        "query": "AmlOnlineEndpointTrafficLog\n| where ResponseCode < 400\n| summarize AvgLatency=avg(TotalLatencyMs),\n            P95Latency=percentile(TotalLatencyMs, 95),\n            P99Latency=percentile(TotalLatencyMs, 99)\n            by bin(TimeGenerated, 5m)\n| render timechart",
        "title": "Request Latency P50, P95, P99",
        "queryType": 0
      }
    }
  ]
}
Create custom metrics dashboard:
from azure.mgmt.dashboard import DashboardManagementClient

dashboard_properties = {
    "lenses": {
        "0": {
            "order": 0,
            "parts": {
                "0": {
                    "position": {"x": 0, "y": 0, "colSpan": 6, "rowSpan": 4},
                    "metadata": {
                        "type": "Extension/HubsExtension/PartType/MonitorChartPart",
                        "settings": {
                            "content": {
                                "metrics": [{
                                    "resourceId": "/subscriptions/.../endpoints/llama",
                                    "name": "RequestLatency",
                                    "aggregation": "Average"
                                }]
                            }
                        }
                    }
                }
            }
        }
    }
}
Alerting and Automated Response
Configure alerts that notify teams when metrics exceed thresholds.
High latency alert:
from azure.mgmt.monitor import MonitorManagementClient
from azure.mgmt.monitor.models import *

alert_rule = MetricAlertResource(
    location="global",
    description="Alert when endpoint latency exceeds 1 second",
    severity=2,
    enabled=True,
    scopes=["/subscriptions/.../onlineEndpoints/llama-endpoint"],
    evaluation_frequency="PT1M",
    window_size="PT5M",
    criteria=MetricAlertMultipleResourceMultipleMetricCriteria(
        odata_type="Microsoft.Azure.Monitor.MultipleResourceMultipleMetricCriteria",
        all_of=[
            MetricCriteria(
                name="HighLatency",
                metric_name="RequestLatency",
                operator="GreaterThan",
                threshold=1000,
                time_aggregation="Average"
            )
        ]
    ),
    actions=[
        ActionGroupResource(
            action_group_id="/subscriptions/.../actionGroups/ops-alerts"
        )
    ]
)
Error rate alert based on log queries:
scheduled_query_rule = LogSearchRuleResource(
    location="eastus",
    description="Alert when error rate exceeds 5%",
    enabled=True,
    source=Source(
        query="""
        AmlOnlineEndpointTrafficLog
        | summarize TotalRequests=count(),
                    Errors=countif(ResponseCode >= 400)
        | extend ErrorRate = (Errors * 100.0) / TotalRequests
        | where ErrorRate > 5
        """,
        data_source_id="/subscriptions/.../workspaces/ml-logs"
    ),
    schedule=Schedule(
        frequency_in_minutes=5,
        time_window_in_minutes=10
    ),
    action=Action(
        severity="2",
        azns_action=AzNsActionGroup(
            action_group=["/subscriptions/.../actionGroups/critical-alerts"]
        ),
        trigger=TriggerCondition(
            threshold_operator="GreaterThan",
            threshold=0
        )
    )
)
Alert on GPU temperature:
gpu_temp_alert = MetricAlertResource(
    location="global",
    description="Alert when GPU temperature exceeds 80°C",
    severity=1,
    enabled=True,
    scopes=["/subscriptions/.../clusters/llm-cluster"],
    evaluation_frequency="PT1M",
    window_size="PT5M",
    criteria=MetricAlertMultipleResourceMultipleMetricCriteria(
        all_of=[
            MetricCriteria(
                name="HighGPUTemp",
                metric_name="gpu_temperature",
                operator="GreaterThan",
                threshold=80,
                time_aggregation="Average"
            )
        ]
    )
)
Alert fatigue kills incident response. We set the right thresholds.
Latency >1s? Error rate >5%? GPU temp >80°C? These thresholds depend on your baseline, not generic defaults.
We help you:
- Establish performance baselines – Know what "normal" looks like for your workload
- Configure multi-tier alerts – Warning (Slack), Critical (PagerDuty)
- Set up action groups – Email, SMS, webhook, ITSM integration
- Prevent alert storms – Suppression rules, cooldown periods, aggregation
Log Analytics and Troubleshooting
Query logs to identify patterns and debug production issues.
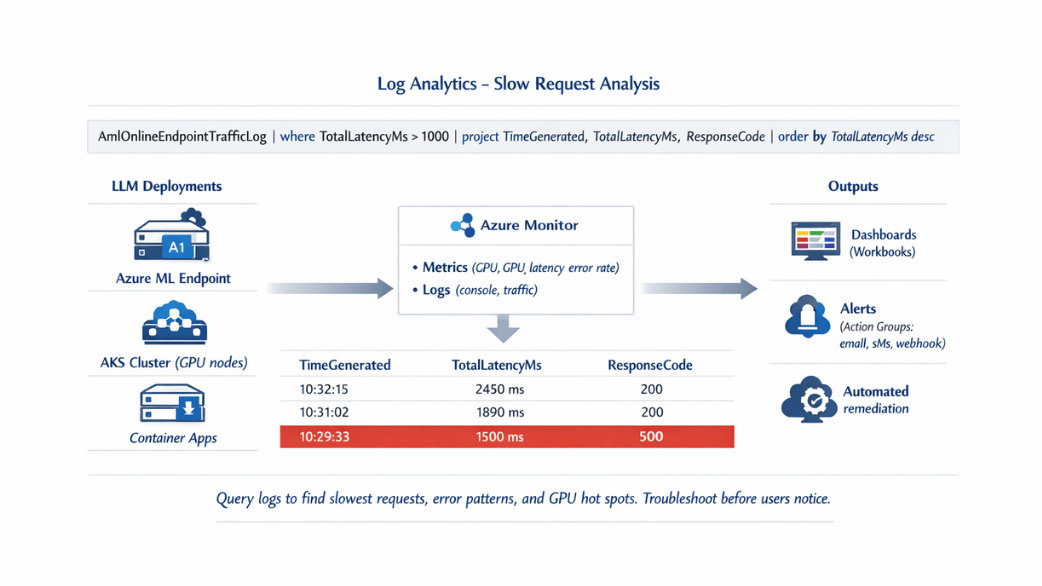
Analyze slowest requests:
AmlOnlineEndpointTrafficLog
| where ResponseCode < 400
| where TotalLatencyMs > 1000
| project TimeGenerated,
          TotalLatencyMs,
          ModelLatencyMs,
          RequestPayloadSize=RequestPayloadSizeInBytes
| order by TotalLatencyMs desc
| take 20
Detect error patterns:
AmlOnlineEndpointConsoleLog
| where LogLevel == "Error"
| extend ErrorType = extract("(\\w+Error|\\w+Exception)", 1, Message)
| summarize ErrorCount=count() by ErrorType, bin(TimeGenerated, 5m)
| render columnchart
Track token usage:
customMetrics
| where name == "tokens_generated"
| extend Model = tostring(customDimensions.model)
| summarize TotalTokens=sum(value),
            AvgTokensPerRequest=avg(value)
            by Model, bin(timestamp, 1h)
| render timechart
GPU utilization trends:
InsightsMetrics
| where Namespace == "container.azm.ms/gpu"
| where Name in ("gpu_utilization", "gpu_memory_used_bytes")
| extend MetricValue = iif(Name == "gpu_memory_used_bytes", Val / 1024 / 1024 / 1024, Val)
| summarize avg(MetricValue) by Name, Computer, bin(TimeGenerated, 5m)
| render timechart
Application Insights and Cost Monitoring
Implement distributed tracing for complex workflows and track infrastructure spending.
Enable Application Insights tracing:
from opencensus.ext.azure.trace_exporter import AzureExporter
from opencensus.trace.tracer import Tracer

tracer = Tracer(
    exporter=AzureExporter(
        connection_string="InstrumentationKey=your-key"
    )
)

def generate_response(prompt):
    with tracer.span(name="inference") as span:
        span.add_attribute("prompt_length", len(prompt))

        with tracer.span(name="tokenize"):
            tokens = tokenizer(prompt)

        with tracer.span(name="model_generate"):
            output = model.generate(tokens)

        with tracer.span(name="decode"):
            response = tokenizer.decode(output)

        span.add_attribute("response_length", len(response))
        return response
Track costs with Azure Monitor:
AzureDiagnostics
| where ResourceProvider == "MICROSOFT.MACHINELEARNINGSERVICES"
| where Category == "ComputeInstanceEvent"
| summarize TotalCost=sum(todouble(CostInUSD)) by bin(TimeGenerated, 1d)
| render columnchart
Create budget alerts:
from azure.mgmt.consumption import ConsumptionManagementClient
from azure.mgmt.consumption.models import *

budget = Budget(
    category="Cost",
    amount=10000,
    time_grain="Monthly",
    time_period=BudgetTimePeriod(start_date="2025-01-01"),
    notifications={
        "Actual_GreaterThan_80_Percent": Notification(
            enabled=True,
            operator="GreaterThan",
            threshold=80,
            contact_emails=["ops@company.com"]
        )
    }
)
Correlate logs across services using correlation IDs:
import uuid

def handle_request(request):
    correlation_id = str(uuid.uuid4())

    logger.info("Request received", extra={
        "correlation_id": correlation_id,
        "user_id": request.user_id
    })

    response = requests.post(
        "https://llama-service/generate",
        headers={"X-Correlation-ID": correlation_id},
        json=request.data
    )

    return response
Query across services:
union AmlOnlineEndpointTrafficLog, ContainerLog
| where * contains "{correlation_id}"
| project TimeGenerated, ServiceName=tostring(split(_ResourceId, "/")[-1]), Message
| order by TimeGenerated asc
Conclusion
Azure Monitor provides production-grade observability for LLM deployments running on Azure ML and AKS: automatic metric collection captures endpoint performance without instrumentation, and custom metrics track business-specific KPIs.
Log Analytics enables powerful querying for troubleshooting, while Application Insights traces requests across distributed services and alerts notify teams before issues impact users. Organizations implementing complete monitoring reduce downtime by 75% and resolve issues 65% faster.
Start with diagnostic settings and built-in metrics, then add custom metrics for business KPIs, create dashboards for visibility, and configure alerts for critical thresholds. Your production deployment stays healthy and performant.
FAQs
1. What metrics should I monitor first for LLM deployments?
Primary Metrics to Monitor First
| Metric | Purpose | Priority |
|---|---|---|
| RequestLatency (P95) | User experience degradation | First |
| ErrorRate | Reliability tracking | First |
| GPU utilization | Capacity planning, cost efficiency | First |
| Tokens per second | Model-specific throughput indicator | Add after basics |
Granularity: Monitor all with 5-minute intervals
2. How do I track cost per inference with Azure Monitor?
Cost per Inference Tracking Steps:
- Use custom metrics with OpenCensus
- Record: tokens generated per request, instance type, model version
- Export to Log Analytics
- Query total tokens by hour
- Multiply by GPU instance cost per hour
- Divide by token throughput
- Dashboard shows cost per 1K tokens trending over time
3. When should I use Application Insights vs Log Analytics?
| Tool | Best For | Use Case |
|---|---|---|
| Application Insights | Distributed tracing across multiple services | Per-request debugging (e.g., prompt preprocessing → inference → post-processing → caching) |
| Log Analytics | Aggregating and querying logs, metrics, and traces from all services | Trend analysis, dashboards |
Recommendation: Use both – App Insights for per-request debugging, Log Analytics for trend analysis and dashboards
4. How do I query container CPU usage in Azure Container Insights?
Use the same InsightsMetrics pattern as the GPU utilization query above, swapping the namespace and metric name for CPU:
InsightsMetrics
| where Namespace == "container.azm.ms/cpu"
| where Name == "cpuUsagePercentage"
| summarize avg(Val) by bin(TimeGenerated, 5m), Computer
| render timechart
Summarize this post with: