Maintain 99.9% Uptime with GCP Monitoring
Monitor LLM deployments with Google Cloud Operations for reliability and performance. Track metrics, set up alerts, and debug production issues with unified observability across Vertex AI, GKE, and Cloud Run.
TLDR;
- 150 MB/month free tier covers metrics for most small-to-medium LLM deployments
- Three-tier alerting prevents issues: critical (page), warning (Slack), info (daily digest)
- Cloud Trace tracks requests across services with OpenTelemetry integration
- Budget alerts at 50%, 90%, and 100% thresholds prevent cost overruns
Introduction
Production LLM deployments face constant challenges. Latency spikes affect user experience. Error rates climb unexpectedly. GPU memory exhausts during peak traffic. Without proper monitoring, you discover these issues only when customers complain or revenue drops.
Google Cloud Operations (formerly Stackdriver) provides unified observability for your entire LLM stack. Monitor Vertex AI endpoints, track GKE pod metrics, analyze Cloud Run performance, and correlate events across services from a single platform. Cloud Monitoring collects metrics automatically from managed services while custom metrics capture application-specific data like token generation rates and prompt processing times.
This guide shows you how to implement production-grade monitoring for LLM deployments. You'll learn to track essential metrics, configure alerting policies, analyze logs at scale, and optimize costs through intelligent observability. Whether serving models on Vertex AI, GKE, or Cloud Run, these monitoring patterns help you maintain 99.9% uptime and deliver consistent performance.
Monitoring Strategy
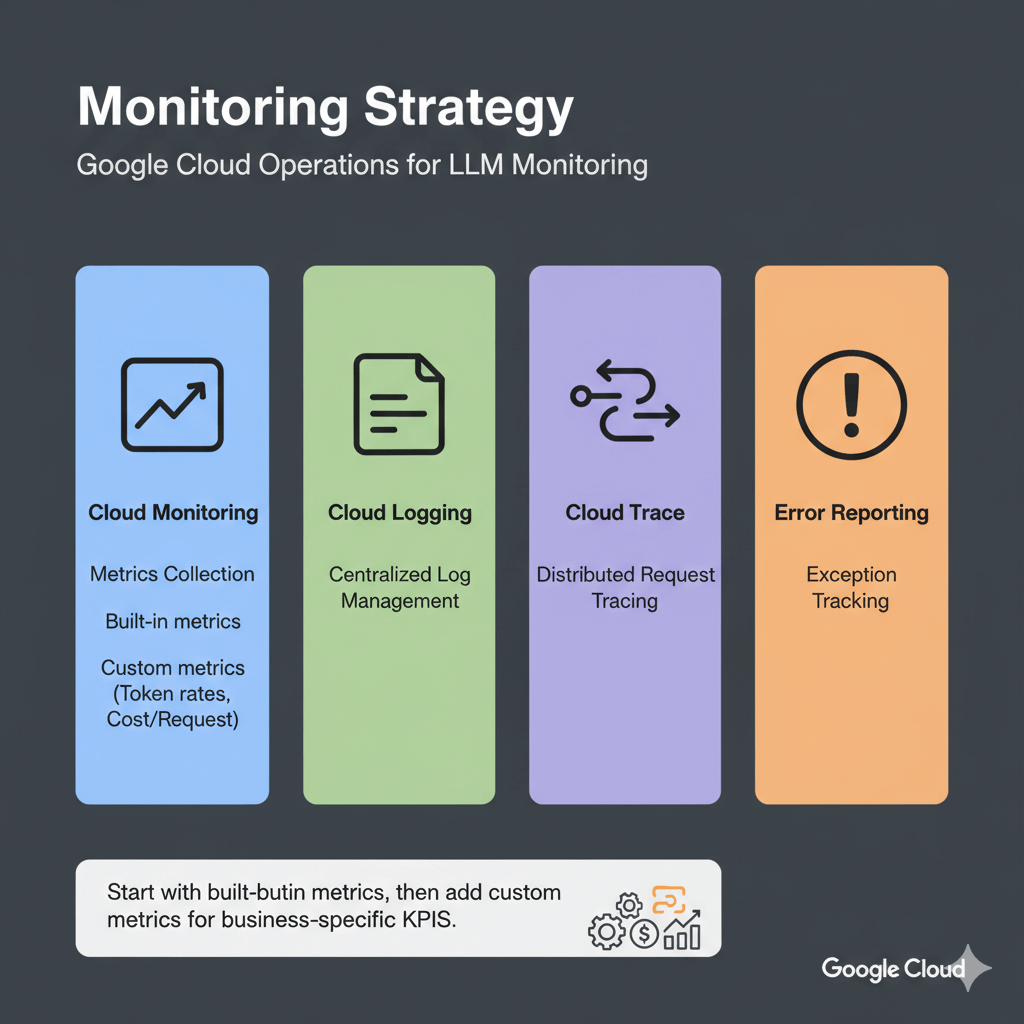
Google Cloud Operations provides four core capabilities for LLM monitoring: Cloud Monitoring for metrics collection, Cloud Logging for centralized log management, Cloud Trace for distributed request tracing, and Error Reporting for exception tracking. Start with built-in metrics from managed services, then add custom metrics for business-specific KPIs like token generation rates and cost per request.
Essential Metrics and Alerting
Track these metrics for healthy LLM deployments across Vertex AI, GKE, and Cloud Run.
Vertex AI Endpoint Metrics
Vertex AI automatically collects prediction count, latencies (P50, P95, P99), error rates, CPU/memory utilization, and replica counts. Query these metrics using the Cloud Monitoring API or view in Console dashboards.
Custom Application Metrics
Track business-specific metrics:
from google.cloud import monitoring_v3
import time

def write_custom_metric(metric_value, metric_type="tokens_generated"):
    client = monitoring_v3.MetricServiceClient()
    project_name = f"projects/{project_id}"

    series = monitoring_v3.TimeSeries()
    series.metric.type = f"custom.googleapis.com/llm/{metric_type}"
    series.resource.type = "generic_task"
    series.resource.labels["project_id"] = project_id
    series.resource.labels["location"] = "us-central1"
    series.resource.labels["namespace"] = "production"
    series.resource.labels["job"] = "llama-inference"
    series.resource.labels["task_id"] = "llama-001"

    point = monitoring_v3.Point()
    point.value.int64_value = metric_value
    point.interval.end_time.seconds = int(time.time())

    series.points = [point]
    client.create_time_series(name=project_name, time_series=[series])

# Use in inference code
def generate_response(prompt):
    start = time.time()
    output = model.generate(prompt)
    latency = (time.time() - start) * 1000

    write_custom_metric(len(output), "tokens_generated")
    write_custom_metric(int(latency), "inference_latency_ms")

    return output
Alerting Policies
Automated alerts prevent outages. Configure alerts for high latency, error rates, and resource exhaustion.
High Latency Alert:
from google.cloud import monitoring_v3

client = monitoring_v3.AlertPolicyServiceClient()
project_name = f"projects/{project_id}"

alert_policy = monitoring_v3.AlertPolicy()
alert_policy.display_name = "LLM High Latency Alert"
alert_policy.conditions = [
    monitoring_v3.AlertPolicy.Condition(
        display_name="P95 latency > 1s",
        condition_threshold=monitoring_v3.AlertPolicy.Condition.MetricThreshold(
            filter='metric.type="aiplatform.googleapis.com/prediction/online/prediction_latencies" resource.type="aiplatform.googleapis.com/Endpoint"',
            aggregations=[
                monitoring_v3.Aggregation(
                    alignment_period={"seconds": 300},
                    per_series_aligner=monitoring_v3.Aggregation.Aligner.ALIGN_DELTA,
                    cross_series_reducer=monitoring_v3.Aggregation.Reducer.REDUCE_PERCENTILE_95
                )
            ],
            comparison=monitoring_v3.ComparisonType.COMPARISON_GT,
            threshold_value=1000,  # 1 second
            duration={"seconds": 300}
        )
    )
]

alert_policy.notification_channels = [
    "projects/PROJECT_ID/notificationChannels/CHANNEL_ID"
]

policy = client.create_alert_policy(
    name=project_name,
    alert_policy=alert_policy
)
Error Rate Alert:
# Alert on high error rate (5% threshold)
error_alert = monitoring_v3.AlertPolicy()
error_alert.display_name = "LLM High Error Rate"
error_alert.conditions = [
    monitoring_v3.AlertPolicy.Condition(
        display_name="Error rate > 5%",
        condition_threshold=monitoring_v3.AlertPolicy.Condition.MetricThreshold(
            filter='metric.type="aiplatform.googleapis.com/prediction/online/error_count" resource.type="aiplatform.googleapis.com/Endpoint"',
            aggregations=[
                monitoring_v3.Aggregation(
                    alignment_period={"seconds": 60},
                    per_series_aligner=monitoring_v3.Aggregation.Aligner.ALIGN_RATE
                )
            ],
            comparison=monitoring_v3.ComparisonType.COMPARISON_GT,
            threshold_value=0.05,  # 5% error rate
            duration={"seconds": 300}
        )
    )
]

client.create_alert_policy(
    name=project_name,
    alert_policy=error_alert
)
Log Analysis and Debugging
Centralized logging with Cloud Logging enables rapid troubleshooting and audit trails.
Structured Logging
import logging
import google.cloud.logging

# Setup Cloud Logging
logging_client = google.cloud.logging.Client()
logging_client.setup_logging()

logger = logging.getLogger(__name__)

# Log with structured data
def log_inference(prompt, response, latency_ms):
    logger.info(
        "Inference completed",
        extra={
            "json_fields": {
                "prompt_length": len(prompt),
                "response_length": len(response),
                "latency_ms": latency_ms,
                "model": "llama-70b",
                "endpoint_id": endpoint_id,
                "timestamp": time.time()
            }
        }
    )
Log Queries
Query logs to find slow requests, errors, or specific patterns using Cloud Logging filters. Filter by resource type, payload fields, timestamp ranges, and severity levels to debug issues quickly.
Create Custom Dashboard
Visualize metrics for quick insights with custom dashboards.
from google.cloud import monitoring_dashboard_v1

client = monitoring_dashboard_v1.DashboardsServiceClient()
project_name = f"projects/{project_id}"

dashboard = monitoring_dashboard_v1.Dashboard()
dashboard.display_name = "LLM Production Dashboard"

# Add latency widget
dashboard.grid_layout.widgets.append(
    monitoring_dashboard_v1.Widget(
        title="Prediction Latency (P95)",
        xy_chart=monitoring_dashboard_v1.XyChart(
            data_sets=[
                monitoring_dashboard_v1.XyChart.DataSet(
                    time_series_query=monitoring_dashboard_v1.TimeSeriesQuery(
                        time_series_filter=monitoring_dashboard_v1.TimeSeriesFilter(
                            filter='metric.type="aiplatform.googleapis.com/prediction/online/prediction_latencies"',
                            aggregation=monitoring_dashboard_v1.Aggregation(
                                alignment_period={"seconds": 60},
                                per_series_aligner=monitoring_dashboard_v1.Aggregation.Aligner.ALIGN_DELTA,
                                cross_series_reducer=monitoring_dashboard_v1.Aggregation.Reducer.REDUCE_PERCENTILE_95
                            )
                        )
                    )
                )
            ]
        )
    )
)

dashboard = client.create_dashboard(
    parent=project_name,
    dashboard=dashboard
)
Cost Tracking and Optimization
Monitor spending on ML infrastructure to control cloud costs.
Query Billing Data
from google.cloud import bigquery

client = bigquery.Client()

# Query billing export
query = """
SELECT
  DATE(usage_start_time) as date,
  service.description as service,
  SUM(cost) as total_cost
FROM
  `project.billing_export.gcp_billing_export_v1_XXXXXX`
WHERE
  DATE(usage_start_time) >= DATE_SUB(CURRENT_DATE(), INTERVAL 30 DAY)
  AND service.description LIKE '%Vertex%'
GROUP BY
  date, service
ORDER BY
  date DESC, total_cost DESC
"""

results = client.query(query)
for row in results:
    print(f"{row.date}: {row.service} = ${row.total_cost:.2f}")
Budget Alerts
from google.cloud import billing_budgets_v1

client = billing_budgets_v1.BudgetServiceClient()
parent = f"billingAccounts/{billing_account_id}"

budget = billing_budgets_v1.Budget()
budget.display_name = "LLM Monthly Budget"
budget.budget_filter.projects = [f"projects/{project_id}"]
budget.budget_filter.services = ["services/aiplatform.googleapis.com"]

# Set $5000 monthly budget
budget.amount.specified_amount.units = 5000

# Alert at 50%, 90%, 100%
budget.threshold_rules = [
    billing_budgets_v1.ThresholdRule(threshold_percent=0.5),
    billing_budgets_v1.ThresholdRule(threshold_percent=0.9),
    billing_budgets_v1.ThresholdRule(threshold_percent=1.0)
]

client.create_budget(parent=parent, budget=budget)
Performance and Reliability Tracking
Track requests across services, monitor SLOs, and identify performance bottlenecks.
Distributed Tracing with Cloud Trace
from opentelemetry import trace
from opentelemetry.exporter.cloud_trace import CloudTraceSpanExporter
from opentelemetry.sdk.trace import TracerProvider
from opentelemetry.sdk.trace.export import BatchSpanProcessor

# Setup Cloud Trace
tracer_provider = TracerProvider()
cloud_trace_exporter = CloudTraceSpanExporter()
tracer_provider.add_span_processor(
    BatchSpanProcessor(cloud_trace_exporter)
)
trace.set_tracer_provider(tracer_provider)

tracer = trace.get_tracer(__name__)

# Trace inference requests
@app.post("/generate")
async def generate(request: GenerateRequest):
    with tracer.start_as_current_span("llm_inference") as span:
        span.set_attribute("model", "llama-70b")
        span.set_attribute("prompt_length", len(request.prompt))

        with tracer.start_as_current_span("model_execution"):
            output = model.generate(request.prompt)

        span.set_attribute("response_length", len(output))
        return {"text": output}
Service Level Objectives
Track service level objectives to maintain reliability.
from google.cloud import monitoring_v3

client = monitoring_v3.ServiceMonitoringServiceClient()
project_name = f"projects/{project_id}"

# Create SLO for 99% availability
slo = monitoring_v3.ServiceLevelObjective()
slo.display_name = "99% Availability SLO"
slo.goal = 0.99

# Define availability metric
slo.service_level_indicator.request_based.good_total_ratio.good_service_filter = (
    'metric.type="aiplatform.googleapis.com/prediction/online/prediction_count" '
    'metric.label.response_code="200"'
)

slo.service_level_indicator.request_based.good_total_ratio.total_service_filter = (
    'metric.type="aiplatform.googleapis.com/prediction/online/prediction_count"'
)

# 30-day rolling window
slo.rolling_period.seconds = 30 * 24 * 60 * 60

client.create_service_level_objective(
    parent=f"{project_name}/services/{service_id}",
    service_level_objective=slo
)
Performance Profiling
Identify bottlenecks with Cloud Profiler. Enable profiling to track CPU hotspots, memory allocations, and heap usage. Typical LLM bottlenecks include model loading (10-30% CPU time), tokenization (5-15% CPU), inference (70-80% GPU), and post-processing (2-5% CPU).
import googlecloudprofiler

googlecloudprofiler.start(
    service='llm-inference',
    service_version='1.0.0',
    verbose=3
)
Conclusion
Effective monitoring transforms LLM deployments from fragile experiments into reliable production systems. Google Cloud Operations provides the observability foundation needed to maintain high availability and performance. Start with built-in metrics from Vertex AI, GKE, or Cloud Run, then enhance monitoring with custom application metrics that track business-specific KPIs like token costs and user satisfaction.
Implement the three-tier alerting strategy covered in this guide: critical alerts for immediate response (endpoint failures, high error rates), warning alerts for proactive investigation (elevated latency, resource pressure), and informational alerts for trend analysis (daily cost summaries, usage patterns). This balanced approach prevents alert fatigue while catching issues before they impact users.
Cost tracking is equally important as performance monitoring. Use BigQuery billing exports to analyze spending patterns across services, set budget alerts at 50%, 90%, and 100% thresholds, and optimize by right-sizing instances based on actual utilization data. Production LLM monitoring typically costs $50-300/month depending on traffic volume, a worthwhile investment that pays for itself through reduced downtime and optimized resource allocation.
Frequently Asked Questions
How much does Cloud Monitoring cost for production LLM deployments?
Cloud Monitoring offers generous free tiers covering most small-to-medium deployments: 150 MB/month metrics, 50 GB/month logs, and basic alerting. Above free tier, metrics cost $0.26/MB and logs cost $0.50/GB ingestion. Typical production deployment generates 50 MB metrics (free), 100 GB logs ($50), 500 GB storage ($5), and traces ($2 for 10M spans). Total: ~$57/month for moderate traffic. High-traffic deployments (1M+ requests/day) reach $200-300/month. Optimize by sampling logs (10% successful, 100% errors), aggregating metrics, and using 30-day retention instead of default 400 days.
What's the best alerting strategy for LLM production deployments?
Implement three-tier alerting to balance responsiveness and alert fatigue. Critical alerts (page immediately): endpoint down >2 minutes, error rate >5% for 5 minutes, P95 latency >2000ms sustained, GPU memory exhaustion, cost spike >100%. Warning alerts (Slack/email within 2 hours): error rate 2-5%, P95 latency 1.5-2x SLA, GPU >90% for 30 minutes, queue depth >50. Info alerts (daily digest): volume trends, cost patterns, quota usage. Start with critical-only alerts for 2 weeks, establish baselines from 95th percentile, then add warnings at 1.5x baseline. Use 5-minute stabilization windows to prevent flapping.
Can I export GCP metrics to third-party monitoring tools?
Yes, Google Cloud supports multiple export paths. Prometheus: deploy Metrics Exporter to scrape via API with 60-second refresh. Datadog: use native GCP integration for automatic collection plus Pub/Sub log forwarding. New Relic: GCP integration collects metrics every 5 minutes. Grafana Cloud: connects directly via Cloud Monitoring data source with PromQL support. Custom tools: query via Monitoring API (REST/gRPC) with filters and aggregations, or stream logs to Pub/Sub for forwarding to Elasticsearch, Splunk, or custom pipelines. Trace exports to Zipkin/Jaeger via OpenTelemetry Collector. Most cost-effective: Cloud Monitoring API periodic polling (free within rate limits). Most flexible: Pub/Sub streaming ($0.40/million messages).