AWS Performance Optimization for EC2, RDS, and Lambda
In this article we will understand how to configure and tune EC2, RDS, and Lambda enables building high-performance applications while controlling costs.
AWS provides extensive infrastructure options for SaaS applications. Each service has distinct performance characteristics and optimization opportunities. Understanding how to configure and tune EC2, RDS, and Lambda enables building high-performance applications while controlling costs.
EC2 Instance Optimization
Instance type selection directly affects performance. Compute-optimized (C-series) instances suit CPU-bound workloads. Memory-optimized (R-series) instances suit applications requiring large memory. General-purpose (M-series) instances balance resources for most web applications.
Instance sizing requires matching resources to actual needs. Undersized instances hit resource limits, causing performance degradation. Oversized instances waste money. Monitor utilization and right-size based on actual usage patterns.
Enable Enhanced Networking for improved network performance. Elastic Network Adapter (ENA) provides higher bandwidth and lower latency than legacy networking. Most modern instance types support ENA.
Placement groups optimize network performance between instances. Cluster placement groups provide lowest latency for tightly coupled workloads. Spread placement groups improve availability by distributing across hardware.
EBS volume performance varies by type. gp3 volumes provide configurable IOPS and throughput. io2 volumes suit I/O-intensive database workloads. Ensure volume performance matches instance capabilities.
# Check EBS volume metrics
aws cloudwatch get-metric-statistics \
  --namespace AWS/EBS \
  --metric-name VolumeReadOps \
  --dimensions Name=VolumeId,Value=vol-12345678 \
  --start-time 2025-01-01T00:00:00Z \
  --end-time 2025-01-02T00:00:00Z \
  --period 3600 \
  --statistics Average
Instance store volumes provide highest IOPS for temporary data. These ephemeral volumes suit caching and temporary processing. Data doesn't survive instance stop/termination.
AMI optimization reduces boot time. Pre-installed dependencies and pre-configured settings speed instance launches. This matters particularly for auto-scaling responsiveness.
RDS Performance Tuning
Instance class selection balances cost and performance. db.r5 and db.r6g instances suit memory-intensive database workloads. Graviton2-based instances (db.r6g) often provide better price-performance.
Storage type affects database performance. Provisioned IOPS (io1/io2) suits consistent high-performance requirements. General Purpose (gp3) suits most workloads with burstable performance needs.
Multi-AZ deployments provide high availability but don't directly improve read performance. Synchronous replication to standby adds slight write latency. Read replicas distribute read traffic effectively.
-- Monitor slow queries in PostgreSQL
SELECT query, calls, mean_time, total_time
FROM pg_stat_statements
ORDER BY total_time DESC
LIMIT 20;
Parameter groups control database configuration. Adjust parameters based on workload characteristics. Key parameters include max_connections, shared_buffers, and query cache settings.
Read replicas scale read capacity. Direct read-heavy queries to replicas, reserving the primary for writes. Application logic or proxy layers handle routing.
Performance Insights provides query-level analysis. Identify slow queries, wait events, and resource bottlenecks. This visibility guides optimization efforts.
Connection pooling reduces connection overhead. RDS Proxy or application-level pooling (PgBouncer, ProxySQL) manages connections efficiently.
Aurora provides performance advantages for suitable workloads. Aurora's distributed storage layer and optimized replication often outperform standard RDS for read-heavy workloads.
Lambda Performance Strategies
Cold starts affect latency for infrequently invoked functions. Provisioned Concurrency keeps functions warm, eliminating cold starts for consistent low latency.
# SAM template with Provisioned Concurrency
Resources:
  MyFunction:
    Type: AWS::Serverless::Function
    Properties:
      Handler: index.handler
      Runtime: nodejs18.x
      ProvisionedConcurrencyConfig:
        ProvisionedConcurrentExecutions: 10
Memory configuration affects both memory and CPU. Increasing memory allocation proportionally increases CPU power. Some functions run faster with more memory despite not needing the memory itself.
Package size affects cold start duration. Smaller deployment packages load faster. Use Lambda layers for shared dependencies. Exclude development dependencies from production packages.
Connection reuse improves performance for functions accessing databases or APIs. Initialize connections outside the handler function to reuse across invocations.
// Connection initialized outside handler - reused across invocations
const client = new DynamoDB.DocumentClient();

exports.handler = async (event) => {
    // client is reused across warm invocations
    const result = await client.get({
        TableName: 'users',
        Key: { id: event.userId }
    }).promise();
    return result.Item;
};
Runtime selection affects performance. Compiled languages (Go, Rust) have faster cold starts than interpreted languages. Node.js and Python offer good balance of performance and developer productivity.
ARM-based Graviton2 processors (arm64 architecture) provide better price-performance for many workloads. Test your functions on arm64 to evaluate benefits.
Network Performance
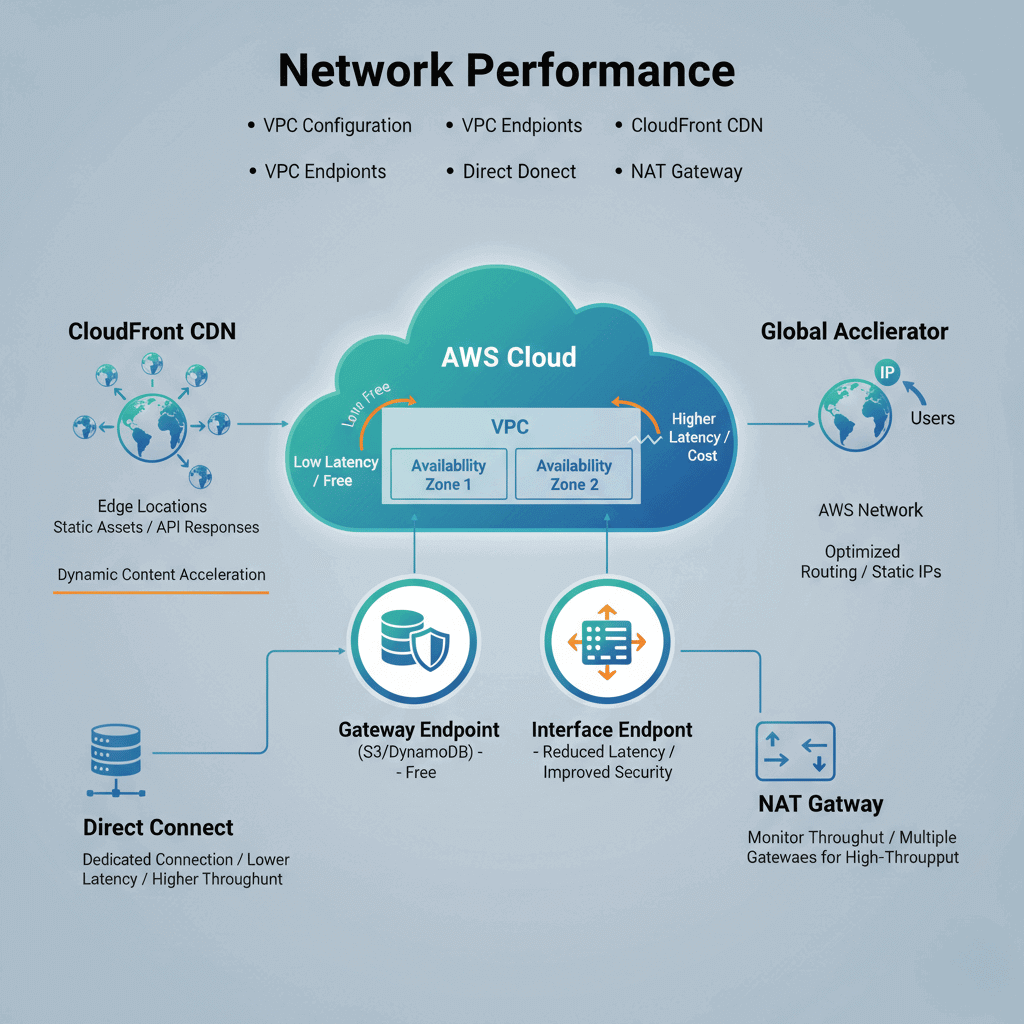
VPC configuration affects latency. Place resources in the same Availability Zone when possible to minimize cross-AZ latency. Cross-AZ traffic also incurs data transfer costs.
VPC endpoints eliminate internet routing for AWS service access. Gateway endpoints for S3 and DynamoDB are free. Interface endpoints for other services reduce latency and improve security.
CloudFront CDN caches content at edge locations. Static assets and cacheable API responses benefit from global edge distribution. Dynamic content acceleration reduces origin latency.
Global Accelerator provides static IP addresses and optimized routing. For global applications, traffic enters AWS network closer to users, reducing latency compared to public internet routing.
Direct Connect provides dedicated network connections. For hybrid architectures or consistent high-bandwidth needs, Direct Connect offers lower latency and higher throughput than VPN.
NAT Gateway throughput limits can constrain private subnet traffic. Monitor NAT Gateway metrics and consider multiple gateways for high-throughput requirements.
Cost-Performance Balance
Reserved Instances reduce costs for predictable workloads. One-year or three-year commitments provide 30-60% savings over On-Demand pricing. Analyze usage patterns before committing.
Spot Instances provide steep discounts for interruption-tolerant workloads. Batch processing, development environments, and stateless workers suit Spot pricing. Combine with On-Demand for reliability.
Savings Plans offer flexibility across instance families. Compute Savings Plans apply to EC2, Lambda, and Fargate. EC2 Instance Savings Plans provide larger discounts for specific instance families.
Right-sizing eliminates waste. AWS Cost Explorer provides right-sizing recommendations. Trusted Advisor identifies underutilized resources.
Auto Scaling matches capacity to demand. Scale down during low-traffic periods to reduce costs. Target tracking policies automate scaling based on utilization.
Reserved Capacity for RDS reduces database costs. Reserve production database instances while using On-Demand for development.
Lambda pricing rewards efficiency. Faster execution means lower costs. Optimization efforts reduce both latency and bills.
Monitoring and Observability
Amazon CloudWatch provides native AWS monitoring. Metrics, logs, and alarms integrate with all AWS services. Custom metrics track application-specific measurements.
X-Ray traces requests across AWS services. Distributed tracing reveals latency breakdown across Lambda functions, API Gateway, DynamoDB, and other services.
CloudWatch Container Insights monitors ECS and EKS workloads. Container-specific metrics complement application monitoring.
# Custom CloudWatch metric
import boto3

cloudwatch = boto3.client('cloudwatch')

cloudwatch.put_metric_data(
    Namespace='MyApp',
    MetricData=[{
        'MetricName': 'RequestLatency',
        'Value': latency_ms,
        'Unit': 'Milliseconds'
    }]
)
Enhanced Monitoring for RDS provides OS-level metrics. CPU, memory, and I/O details beyond standard CloudWatch metrics aid database troubleshooting.
Set up alarms proactively. Alert on high CPU, memory pressure, queue depth, and error rates before users experience problems.
Log insights enable query analysis. CloudWatch Logs Insights queries across log groups. Identify patterns and anomalies in application logs.
Architecture Patterns
Multi-tier architecture separates concerns. Web tier, application tier, and data tier scale independently. Each tier optimizes for its specific workload characteristics.
Caching tiers reduce database load. ElastiCache (Redis or Memcached) caches frequently accessed data. CloudFront caches static and dynamic content at the edge.
Queue-based decoupling improves resilience. SQS queues between components absorb traffic spikes. Workers process at sustainable rates without overwhelming downstream services.
Event-driven patterns with Lambda enable serverless scaling. SNS, EventBridge, and SQS trigger Lambda functions. Auto-scaling happens automatically.
Read replica patterns distribute database load. Application routing directs read queries to replicas. The primary handles writes and strongly consistent reads.