A/B Testing and Load Testing Methodologies for SaaS Optimization
Master A/B testing and load testing for SaaS in 2026. Validate performance gains, find breaking points, and optimize with data-driven insights.

TL;DR
- Combine Both for Real Impact: Use A/B testing to validate if a performance change (like faster load times) actually improves user behavior and business metrics. Use load testing to find your system's breaking points and capacity limits before traffic hits.
- A/B Test Design is Critical: Define a clear, testable hypothesis (e.g., "Caching will cut response time by 50% and lift conversions by 2%"). Control for variables like user segments and the "novelty effect," and ensure statistical significance with a proper sample size.
- Load Tests Must Be Realistic: Don't just hammer an endpoint. Model tests on production traffic—include think time, varied user journeys, realistic data volumes, and error scenarios. Use different types (capacity, soak, spike) to uncover different issues.
- Make It Continuous and Actionable: Integrate performance checks into your CI/CD pipeline to catch regressions early. Always interpret results by looking at percentiles (especially p95/p99) , correlate technical wins with user impact, and turn every test into a clear decision.
Optimization without measurement is guesswork. A/B testing validates that changes actually improve user outcomes.
Load testing ensures your application handles real-world traffic. Together, these methodologies transform performance optimization from intuition-driven to evidence-based practice.
A/B Testing for Performance Optimization
A/B testing compares two versions of something to determine which performs better. While commonly used for UX and conversion optimization, A/B testing also validates performance improvements.
Performance A/B tests measure whether optimization changes produce expected user experience improvements. A backend optimization might reduce server response time, but does it actually improve conversion rates or engagement metrics?
The challenge with performance testing is isolating performance effects. Users in the "B" group receive optimized code, but they also might have different network conditions, devices, or usage patterns. Proper experimental design controls for these variables.
Statistical significance matters particularly for performance tests. Performance metrics often have high variance. A 5% improvement might not be statistically significant with small sample sizes. Ensure tests run long enough to achieve confidence in results.
Consider both technical and business metrics. Technical improvements (lower TTFB, faster LCP) should correlate with business outcomes (higher engagement, lower bounce rates). Measuring both confirms the value of performance work.
👉 Learn how to track real-world performance metrics using GCP Monitoring for performance optimization.
A/B testing performance requires proper instrumentation. Users in each group must be consistently tracked. Performance metrics must be collected per group. This infrastructure investment pays dividends across multiple tests.
Designing Performance A/B Tests
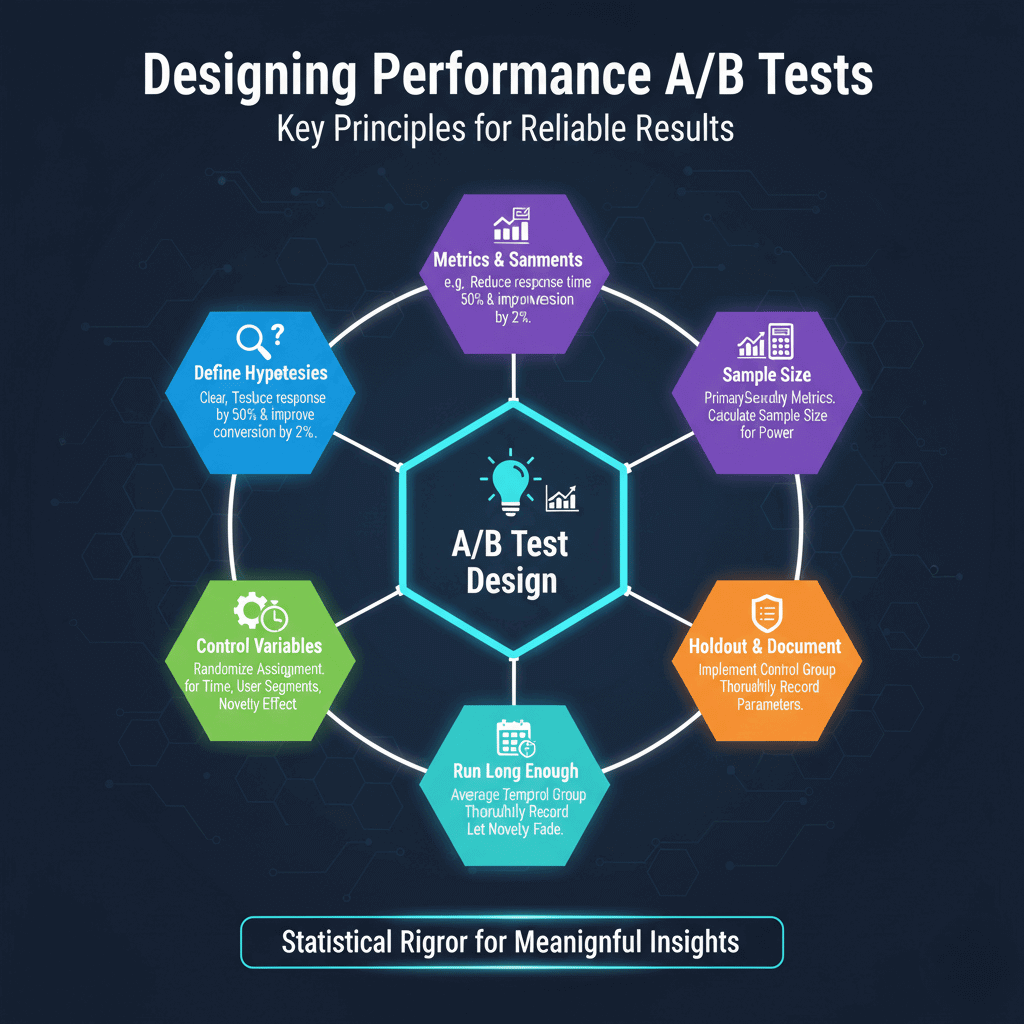
Define hypotheses clearly before testing. "Adding caching will reduce response time by 50% and improve conversion by 2%" is testable. "Making the app faster" is not specific enough to evaluate.
Identify primary and secondary metrics. Primary metrics should directly measure the hypothesis. Secondary metrics catch unexpected effects. If your primary goal is conversion improvement, also monitor error rates and user satisfaction.
Calculate required sample size before starting. Statistical power calculators determine how many users each group needs for reliable conclusions. Running tests with insufficient sample sizes wastes time and produces unreliable results.
Control for confounding variables. Time of day, day of week, user segments, and geographic distribution all affect results. Randomize assignment and run tests long enough to average out temporal effects.
Consider the "novelty effect." Users might respond differently to something new regardless of its actual performance. Run tests long enough for novelty to fade.
Implement proper holdout groups. Some portion of users should receive unchanged experience to establish baseline behavior. This control group enables accurate measurement of change impact.
Document test parameters thoroughly. Future analysis requires understanding exactly what was tested, when, and on whom. Records also prevent accidentally re-running similar tests.
Load Testing Fundamentals
Load testing simulates user traffic to evaluate application behavior under load. It answers questions like: How many users can the system support? What happens as load increases? Where do bottlenecks emerge?
Start with baseline measurements. Before increasing load, understand how the system behaves with minimal traffic. This baseline provides comparison points for loaded behavior.
Ramp load gradually rather than applying full load immediately. Gradual ramp-up reveals at what point performance begins degrading. Sudden load spikes might cause failures that mask the actual breaking point.
Monitor both application metrics and infrastructure during tests. Response times, error rates, and throughput measure application behavior. CPU, memory, network, and disk I/O reveal infrastructure constraints.
Test with realistic data. An application querying a database with 100 test records performs differently than one querying millions of production records. Use realistic data volumes.
Consider session behavior, not just individual requests. Real users perform sequences of actions. Load tests should simulate realistic user journeys including authentication, navigation, and state changes.
Separate different types of load tests. Capacity tests determine maximum throughput. Soak tests verify stability over extended periods. Spike tests check handling of sudden traffic surges. Each reveals different information.
Creating Realistic Load Tests
Analyze production traffic patterns to model realistic load. Request distribution across endpoints, timing of actions within sessions, and traffic variation throughout the day all affect results.
Use production logs to generate test scenarios. Real user behavior provides the most realistic test patterns. Tools can replay anonymized production traffic or generate traffic matching production patterns.
Include think time between actions. Real users pause to read, think, and input data. Tests without think time generate unrealistically dense traffic that may not match production behavior.
Vary user behavior within tests. Not all users follow identical paths. Include variation in navigation patterns, feature usage, and session duration. This variation stress-tests the full application rather than single hot paths.
Include authenticated and unauthenticated traffic in appropriate proportions. Authentication often affects caching and session handling. Tests should match production authentication patterns.
Test from realistic locations. Geographic distribution of users affects network latency and CDN effectiveness. Distributed load generation reveals geographic performance variation.
Include error scenarios. Real traffic includes failed logins, invalid inputs, and error conditions. Tests should include realistic error rates to evaluate error handling under load.
# Example k6 load test scenario
export const options = {
  stages: [
    { duration: '5m', target: 100 },  // Ramp to 100 users
    { duration: '10m', target: 100 }, // Hold at 100 users
    { duration: '5m', target: 500 },  // Ramp to 500 users
    { duration: '10m', target: 500 }, // Hold at 500 users
    { duration: '5m', target: 0 },    // Ramp down
  ],
  thresholds: {
    http_req_duration: ['p95<500'], // 95th percentile under 500ms
    http_req_failed: ['rate<0.01'], // Error rate under 1%
  },
};
Stress Testing and Breaking Point Analysis
Stress testing pushes beyond normal capacity to find breaking points. Understanding limits enables capacity planning and reveals how systems fail.
Increase load until something breaks. The breaking point reveals the weakest component in your architecture. This might be database connections, CPU capacity, memory limits, or external service rate limits.
Observe how failure manifests. Does the system fail gracefully with clear error messages? Do response times degrade gradually or collapse suddenly? Does the system recover after load decreases?
Test recovery after failure. Reduce load and verify the system returns to normal operation. Some failures require manual intervention to recover; identify these scenarios before they happen in production.
Find cascade failure points. When one component fails, do others fail? Understanding failure propagation helps design better resilience. Circuit breakers and bulkheads should limit cascade effects.
Document capacity limits clearly. "System supports 1,000 concurrent users with p95 response time under 500ms" provides actionable planning information. Vague understanding of limits enables vague capacity planning.
Test failure modes for dependencies. What happens when the database becomes slow? When external services timeout? Simulating dependency problems reveals application resilience.
Compare breaking points across releases. Performance characteristics change as applications evolve. Regular stress testing catches capacity regressions before they affect production.
Continuous Performance Testing
Integrate performance tests into development workflows. Running tests only before major releases misses regressions introduced between releases.
Include performance benchmarks in CI/CD pipelines. Automated tests on every merge request catch regressions before they reach production. Set thresholds that fail builds when performance degrades.
Create lightweight tests for frequent execution. Full load tests take time. Quick performance smoke tests verify basic performance on every deployment. Reserve thorough testing for staging deployments.
Track performance metrics over time. Dashboards showing performance trends across releases reveal gradual degradation. Point-in-time tests might not reveal slow deterioration.
Alert on performance regressions. Automated comparison between current and historical performance enables rapid detection of problems.
Balance test coverage with execution time. Testing every endpoint under all conditions isn't practical. Prioritize tests covering high-traffic endpoints and critical user journeys.
Maintain test environments that match production. Performance in development environments often differs dramatically from production. Staging environments should mirror production configuration, data volume, and infrastructure.
Interpreting and Acting on Results
Distinguish between statistical noise and meaningful changes. Performance metrics vary naturally. Ensure differences between tests exceed normal variation before drawing conclusions.
Consider percentiles rather than just averages. Averages hide important details. A test with good average response time but terrible 99th percentile has problems that averages obscure.
Correlate technical metrics with user impact. Response time improvements should appear in business metrics. If technical metrics improve but user behavior doesn't change, question whether the optimization matters.
Document baseline measurements and test conditions. Results only matter in context. What were the comparison points? What load was applied? What was the infrastructure configuration?
Create action items from test results. Tests without follow-up actions waste effort. Each test should produce decisions: ship the change, reject it, or investigate further.
Share results broadly. Performance test results inform many decisions beyond immediate optimization. Product teams, infrastructure teams, and leadership all benefit from understanding application capacity.
Build institutional knowledge from testing. Document patterns that work and don't work. Create playbooks for common scenarios. This knowledge accelerates future testing and optimization.
Conclusion
Effective SaaS optimization isn't a one-time project but a continuous cycle of hypothesis, measurement, and action. By combining the validation power of A/B testing with the capacity insights of load testing, teams can move beyond guesswork.
The key is to treat these methodologies not as isolated checks, but as integrated practices. Regularly testing performance in development, staging, and production ensures that every change is an improvement and that your infrastructure can reliably handle user demand, ultimately driving both technical excellence and business growth.
Frequently Asked Questions
How is A/B testing for performance different from regular A/B testing?
It focuses on validating technical changes. Instead of testing a new button color, you test a backend optimization (like a new caching strategy).
The goal is to see if the technical improvement (e.g., faster Time to First Byte) leads to a positive change in business metrics (e.g., higher conversion or lower bounce rates).
What's the most common mistake in load testing?
Creating unrealistic traffic. Many tests just hammer a single endpoint with no "think time" or variation. This doesn't reflect real user behavior.
To get meaningful results, you must simulate realistic user journeys, include varied actions, add pauses, and use production-like data volumes.
How do I get started if we have no performance tests today?
Start small and build. First, establish a baseline by measuring your current performance under normal conditions.
Then, implement simple load tests for your most critical user journey using a script from the article. Finally, begin running these tests automatically in your CI/CD pipeline to catch regressions before they reach users.
Summarize this post with:
Ready to put this into production?
Our engineers have deployed these architectures across 100+ client engagements — from AWS migrations to Kubernetes clusters to AI infrastructure. We turn complex cloud challenges into measurable outcomes.