How Performance Optimization Drives User Retention and Growth for Startups
Learn how performance optimization directly improves user retention, trial conversion, and word-of-mouth growth. Connect speed metrics to business outcomes with proven measurement strategies.
TL;DR
- Performance drives retention silently: Users blame "needs" or "better solutions," not slowness. But performance often underlies both.
- Measure the connection: Segment users by fast vs. slow experience. Compare retention rates. If slow users churn more, you've proven the link.
- Friction accumulates: A 2-second dashboard feels fine but daily dozens of times creates frustration → eventual churn. Optimize core workflows, not edge cases.
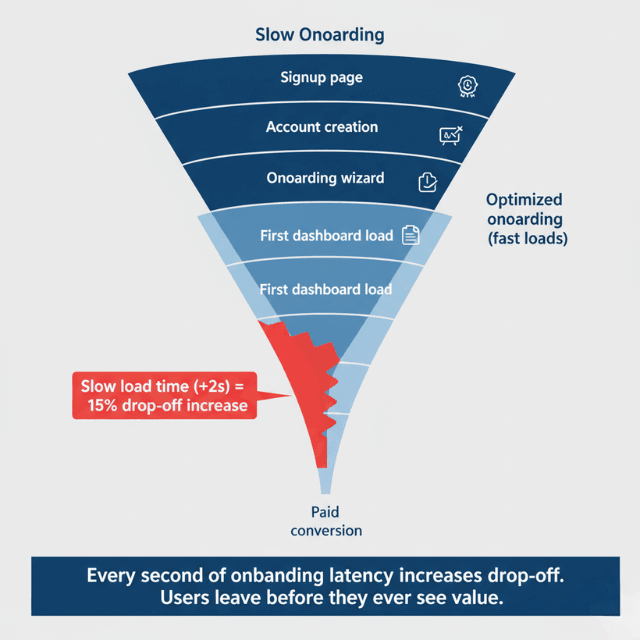
- Onboarding performance shapes first impressions: Slow free trials create lasting doubt. Fast onboarding increases trial conversion.
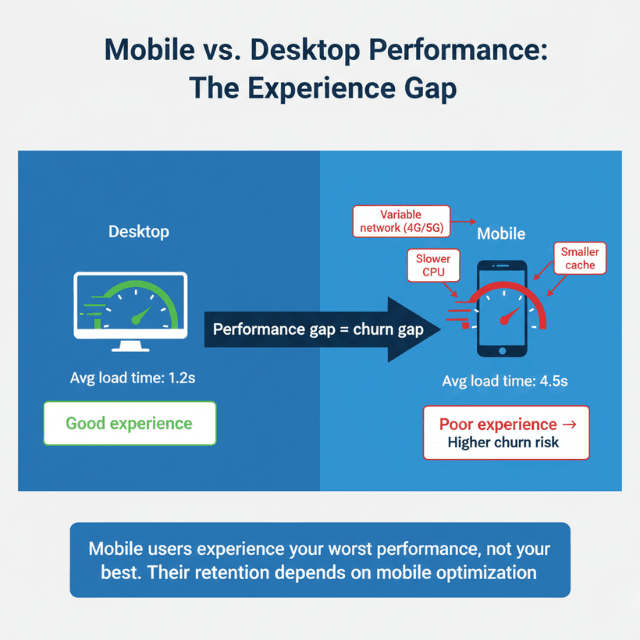
- Mobile users see your worst case: Variable networks magnify inefficiencies. Their retention depends on performance you don't see.
- Performance affects word-of-mouth: Slow = bad reputation on G2, Capterra, social media. Repels potential customers.
- Build retention-focused practices: Set performance budgets for onboarding + daily use. Tie retention metrics to performance reviews.
User retention determines startup survival. Acquiring customers costs significantly more than keeping them. When users abandon your application due to frustrating performance, you lose not just their subscription revenue but the word-of-mouth referrals they would have provided. Performance optimization directly improves retention metrics and enables sustainable growth.
The Retention and Performance Connection
User expectations for application performance continue rising. Netflix, Google, and Amazon have conditioned users to expect near-instant responses. When your SaaS application fails to meet these expectations, users don't consciously think about latency metrics. They simply feel that something is wrong with the product.
Friction from slow performance accumulates. A dashboard that takes two seconds to load doesn't seem problematic in isolation. But users accessing that dashboard dozens of times daily experience those delays as significant productivity loss. This daily frustration builds toward eventual churn.
The relationship between performance and retention isn't always obvious in data. Users rarely cite "slow performance" in cancellation surveys. They report that the product "didn't meet their needs" or that they "found a better solution." Yet performance often underlies these explanations. The better solution they found simply felt better to use.
Retention compounds. A 5% improvement in monthly retention dramatically increases customer lifetime value. If performance optimization contributes even a portion of that improvement, the investment returns multiples. Small retention gains from performance work generate outsized long-term value.
Mobile users face amplified performance challenges. Variable network connectivity magnifies every inefficiency. Users accessing your SaaS application during commutes or from client sites experience your worst-case performance, not your best. Their retention depends on performance you might never observe from office connections.
Enterprise customers experience performance problems as organizational costs. When hundreds of employees waste seconds per interaction, the cumulative productivity loss becomes significant. Enterprise buyers evaluate these costs, making performance a procurement factor that affects both initial sales and renewal decisions.
Measuring Performance Impact on Retention
Connecting performance metrics to retention requires deliberate measurement. Standard analytics show churn rates and performance separately. Building the connection requires correlating these datasets.
Segment users by performance experience. Identify users who experienced above-average response times versus those who experienced below-average response times. Compare retention rates between these segments. If users with poor performance experiences churn at higher rates, you've established a measurable relationship.
Track performance alongside engagement metrics. Session duration, feature adoption, and return visit frequency all relate to performance. Users experiencing slow applications may use fewer features, not because features lack value, but because accessing them feels tedious.
Implement Real User Monitoring (RUM) to capture actual user experiences. Synthetic monitoring tests performance from standardized locations. RUM captures what individual users actually experience, including variations from network conditions, device capabilities, and geographic location.
Create performance cohorts in your analytics. Tag users based on their typical performance experience. Track these cohorts through your customer lifecycle. Measure trial conversion, feature adoption, and retention for each cohort separately.
Survey churned customers specifically about performance. Standard exit surveys may not elicit performance feedback unprompted. Add questions specifically asking about application speed and responsiveness. Compare feedback from high-performing experience users versus low-performing experience users.
Set performance benchmarks for critical user journeys. Define acceptable performance for signup, onboarding, core feature access, and settings changes. Monitor these journeys specifically. Alert when performance degrades on high-impact paths.
Reducing Churn Through Speed Improvements
Optimization efforts should prioritize features with highest retention impact. Not all slow endpoints equally affect users. Focus on the interactions users perform frequently and the flows that determine whether they derive value from your product.
Onboarding performance shapes initial value realization. Users who struggle through slow onboarding may never reach the "aha moment" where your product's value becomes clear. Fast onboarding accelerates time-to-value, increasing the probability that users stay.
Core workflow performance matters most. Identify the features users access daily. For project management tools, task list loading matters more than admin settings performance. For analytics platforms, dashboard rendering matters more than export functionality. Optimize what users experience constantly.
Performance during critical moments carries outsized weight. The moment a user contemplates cancellation, your application's responsiveness influences their decision. Slow performance during billing page access or account management confirms frustrations. Fast performance might prompt reconsideration.
Address performance variance with web vitals guidelines, not just average performance. Users remember their worst experiences more than typical experiences. A feature that usually loads in 500 milliseconds but occasionally takes five seconds creates negative impressions disproportionate to its frequency.
Communicate improvements to users. When you make significant performance improvements, let users know. This communication serves multiple purposes: it shows you're listening to frustrations, it prompts users to re-evaluate their experience, and it builds confidence that the product continues improving.
Consider progressive enhancement for complex features. Render initial content quickly, then load additional elements asynchronously. Users perceive faster performance even when total load time remains similar. The perception of speed matters as much as actual speed.
Trial Conversion Optimization
Free trial periods represent critical evaluation windows. Users form lasting impressions during trials. Performance problems during this period create doubts that persist even if you later improve.
First impressions form within seconds. Initial page loads and signup flows set expectations. Users experiencing slow initial interactions assume the product itself is low quality. Fast initial experiences create positive expectations that color subsequent evaluation.
Trial users explore broadly. Unlike established users who settle into workflows, trial users click around to understand capabilities. This exploration means they encounter performance across many features. Consistent fast performance throughout builds confidence.
Compare trial conversion rates across performance cohorts. Trial users who experience fast performance should convert at higher rates than those who experience slow performance. If you cannot demonstrate this difference, either performance is already adequate or you're not measuring accurately.
Optimize the specific paths trial users follow. Analyze trial user behavior to understand common exploration patterns. Ensure these paths perform optimally. Trial users often access features that power users rarely touch.
Reduce time-to-value through baymard Institute checkout performance. The faster trial users reach the moment where they understand your product's value, the more likely they convert. Performance improvements that accelerate this journey directly increase conversion rates.
Consider performance-based trial extensions. Users who experienced measurable performance problems during trials might warrant extensions or special attention. This approach recovers users who might otherwise churn due to atypical experiences.
User Engagement and Session Quality
Session quality metrics reveal how performance affects engagement. Users interacting with slow applications behave differently than users interacting with fast applications. These behavioral patterns predict retention.
Session duration correlates with performance. Users frustrated by slow responses end sessions earlier. They accomplish less per session and may defer tasks to later. Shorter, less productive sessions indicate disengagement that precedes churn.
Feature adoption suffers when feature access is slow. Users avoid features that feel tedious to use. Analytics may show low feature adoption that appears to indicate lack of interest. The actual cause might be performance problems discouraging exploration.
Return visit frequency indicates engagement depth. Users who find your application pleasant to use return more frequently. Users who find it frustrating delay returns until necessity demands. Track return visit patterns alongside performance experiences.
Task completion rates measure practical value delivery. Users abandon slow workflows before completing tasks. These abandoned tasks represent unrealized value. Track completion rates for key workflows and correlate with performance.
Peak usage periods amplify engagement challenges. When many users access your application simultaneously, performance may degrade precisely when engagement matters most. Ensure infrastructure scales to maintain performance during peak periods.
Mobile engagement requires mobile performance optimization. Users accessing your application from mobile devices often have less patience and more distractions. Mobile performance optimization may require different approaches than desktop optimization.
Word of Mouth and Organic Growth
Satisfied users recommend products to colleagues. Frustrated users warn others away. Performance shapes these informal communications that influence growth.
Net Promoter Scores reflect performance experiences. Users experiencing consistently fast performance score higher on NPS surveys. Users experiencing frustrating performance score lower. Even when survey questions don't mention performance, it influences responses.
Developers and technical users talk about tools they use. Engineering teams share recommendations in communities, forums, and casual conversations. An application's performance reputation spreads through these channels. Being known for fast performance attracts users; being known for slow performance repels them.
Review sites capture performance sentiment. G2, Capterra, and similar platforms publish user reviews that mention performance. Potential customers read these reviews during evaluation. Performance problems appearing in reviews damage acquisition beyond the users who wrote them.
Social media amplifies both praise and complaints. Users frustrated by performance problems may vent publicly. Users delighted by fast performance may share that experience too. Performance contributes to your application's public perception.
Referral program success depends on product satisfaction. Users don't refer products that frustrate them. Referral programs only succeed when referrers confidently recommend your product. Performance shapes that confidence.
Case studies and testimonials reference performance. When asking customers for testimonials, performance often appears as a positive attribute. "Faster than alternatives" becomes a marketing asset. Conversely, performance problems prevent customers from providing glowing recommendations.
Building Retention-Focused Performance Practices
Sustainable retention improvement requires systematic performance practices. One-time optimization produces temporary benefits. Ongoing attention maintains and improves retention impact.
Establish performance budgets tied to user journey stages. Define acceptable performance for onboarding, daily use, and account management. Monitor these budgets continuously. Alert when performance degrades on retention-critical paths.
Include retention metrics in performance reviews. When evaluating optimization efforts, measure retention impact alongside technical metrics. Performance improvements that don't improve retention may need different prioritization than those that do.
Create feedback loops between support and engineering. Customer support hears performance complaints that never reach engineering. Establish channels for support to communicate performance issues. These reports highlight retention-critical problems that monitoring might miss.
Survey users about performance periodically. Standard NPS surveys may not surface performance feedback. Supplement with performance-specific surveys to understand how users perceive your application's speed and responsiveness.
Prioritize performance work that affects retention. Limited engineering capacity requires prioritization. When choosing between performance improvements, favor those affecting frequently-used features and retention-critical workflows.
Measure and communicate results. Track retention improvements that follow performance optimizations. Share these results with stakeholders to justify continued performance investment. Build organizational understanding that performance directly drives business outcomes.
Conclusion
Performance optimization is not a technical exercise it's a growth strategy. The connection between speed and retention is measurable, causal, and compounding. A 5% improvement in monthly retention dramatically increases customer lifetime value.
Small retention gains from performance work generate outsized long-term returns. Yet many startups treat performance as a "nice to have" deferred until after product-market fit, missing the opportunity to build retention into their product from day one.
The most successful SaaS companies measure performance not just in milliseconds but in retention lift, trial conversion, and NPS. They optimize what users use constantly, prioritize mobile performance, and communicate improvements to users.
They understand that every slow interaction is a small tax on user patience, and that tax compounds until users leave. Start measuring the performance-retention connection today. The data will tell you where to invest and the growth will follow.
FAQs
How do I actually measure the connection between performance and retention?
Four steps:
- Implement Real User Monitoring (RUM) to capture actual user experiences (not synthetic tests).
- Segment users by performance experience: Create cohorts of "fast experience" users (e.g., p95 load time < 2s) and "slow experience" users (p95 > 5s).
- Compare retention rates between cohorts at 30, 60, and 90 days.
- Control for confounding variables (user geography, device type, plan tier) to isolate performance impact.
Many analytics platforms (Amplitude, Mixpanel) support this segmentation. If you can't demonstrate the connection in your data, either performance is already adequate or you're not measuring the right metrics.
Which performance improvements have the highest retention ROI?
Prioritize in this order:
- Onboarding & first value experience: Users who reach the "aha moment" quickly are far more likely to retain.
- Core daily workflows: The features users access constantly (dashboard, task list, search).
- Mobile performance: Often the worst experience and the highest churn risk.
- Performance variance (p99): Users remember their worst experience more than the average. Fix the outliers.
- Low-frequency, high-importance actions: Billing, account settings, export these happen rarely but during critical moments (like potential cancellation).
How do I convince my team to prioritize performance over features?
Bring retention data, not opinions. Run the cohort analysis above. If slow-performance users churn at 20% higher rates, quantify that as lost revenue. Example: "Improving load time from 5s to 2s for our dashboard could retain 500 additional users monthly, worth $50K in annual recurring revenue." Then propose a small, measurable performance sprint (2 weeks) with clear retention targets. Track and share results. Success builds momentum. Also, align with existing business goals: if retention is a company priority, performance work directly serves it. Frame performance as a retention feature, not a technical debt project.
Summarize this post with:
Ready to put this into production?
Our engineers have deployed these architectures across 100+ client engagements — from AWS migrations to Kubernetes clusters to AI infrastructure. We turn complex cloud challenges into measurable outcomes.