Database Optimization for Slow Queries and Indexing Issues
Master database optimization with proven query tuning, indexing strategies, and performance monitoring. Learn to identify bottlenecks, fix N+1 queries, and scale database performance for SaaS applications.
TL;DR
- Most performance problems fall into three buckets: slow queries, missing indexes, or connection mismanagement. Identify which one you're facing before optimizing.
- Find slow queries first: Enable slow query logging, then use EXPLAIN ANALYZE to understand execution plans. Look for full table scans (Seq Scan), mismatched row estimates, and expensive joins.
- Index strategically, not obsessively: Create indexes for WHERE clause columns, JOIN conditions, and ORDER BY columns. Composite indexes work best when queries filter on leading columns. Remove unused indexes—they slow writes without helping reads.
- Fix common query anti-patterns:
- N+1 queries: Use eager loading (
select_relatedin Django,includesin Rails) instead of looping queries. - SELECT * : Request only needed columns—reduces network and memory overhead.
- LIKE '%search' with leading wildcards can't use indexes; consider full-text search.
- COUNT(*) on huge tables: Use approximate counts, cached counters, or limit the maximum.
- N+1 queries: Use eager loading (
- Manage connections like a finite resource: Configure connection pools with appropriate sizes. Set timeouts to prevent runaway queries. Consider connection poolers (PgBouncer, ProxySQL) for high-scale apps.
- Monitor continuously: Track query execution times, lock waits, and resource utilization. Set alerts for CPU >80%, memory pressure, or slow query spikes. Catch problems before users do.
Database performance determines application performance. When queries take seconds instead of milliseconds, every feature touching that data feels slow. Users don't blame the database; they blame your application. Optimizing database performance often provides the highest leverage for improving overall SaaS application speed.
Understanding Database Performance Bottlenecks
Most database performance problems fall into a few categories. Slow queries consume excessive time and resources. Missing indexes force full table scans. Poor schema design creates inefficient data access patterns. Connection limits cause request queuing.
Query execution time compounds quickly. A single query taking 500 milliseconds might seem acceptable. But when dozens of queries execute per request, and concurrent users multiply that load, the database becomes the bottleneck limiting your entire application.
Database servers have finite resources. CPU processes queries. Memory caches data and indexes. Disk I/O retrieves data not in memory. Network transfers results to applications. Bottlenecks in any resource constrain overall performance.
Read-heavy workloads behave differently from write-heavy workloads. Typical SaaS applications perform many more reads than writes. Optimization strategies differ accordingly. Read optimization focuses on caching and query efficiency. Write optimization focuses on transaction design and lock management.
Data volume changes performance characteristics. Queries that performed well on small datasets may struggle as data grows. Regular performance testing with production-scale data prevents surprises as your application scales.
Your ORM may hide database problems. Object-relational mapping tools abstract database operations but can generate inefficient queries. Understanding what queries your ORM produces is essential for optimization.
Query Analysis and Optimization
Find slow queries before optimizing them. Enable slow query logging in your database. Set thresholds appropriate for your performance requirements. Review logs regularly to identify optimization candidates.
Use EXPLAIN to understand query execution. EXPLAIN reveals how the database plans to execute a query. It shows table scan types, index usage, join methods, and estimated row counts. This information guides optimization decisions.
-- PostgreSQL example
EXPLAIN ANALYZE SELECT users.*, orders.*
FROM users
JOIN orders ON users.id = orders.user_id
WHERE users.status = 'active';

-- Look for Seq Scan (full table scan) vs Index Scan
-- Check estimated vs actual row counts
-- Note join types and buffer usage
Reduce result set size. Query only the columns you need. Add appropriate WHERE clauses to filter early. Use LIMIT for paginated results. Smaller result sets process faster and use less memory.
Avoid SELECT *. Explicit column lists retrieve only needed data. This reduces network transfer, memory usage, and prevents problems when schema changes add large columns.
Restructure queries for efficiency. Subqueries can often be rewritten as JOINs. Complex OR conditions may perform better as UNION queries. Breaking apart large queries sometimes reveals optimization opportunities invisible in the original.
Watch for implicit type conversions. Comparing a string column to an integer forces conversion on every row. Explicit typing or column type changes eliminate this overhead.
Indexing Strategies That Work
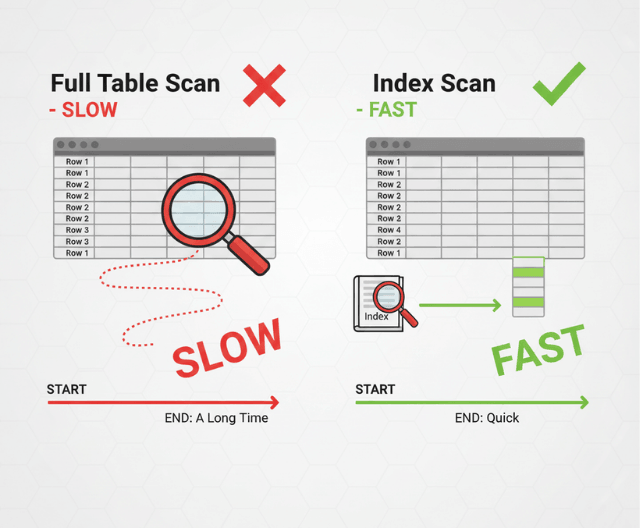
Indexes accelerate data retrieval but add overhead. Each index requires storage space and slows write operations. Index strategically rather than indexing everything.
Create indexes for columns in WHERE clauses. When queries filter on a column, an index allows the database to locate matching rows directly rather than scanning the entire table.
Index columns used in JOIN conditions. Joining tables on unindexed columns requires comparing every row. Indexes make joins dramatically faster.
Consider column order in composite indexes. Multi-column indexes work best when queries filter on leading columns. An index on (country, city) helps queries filtering on country alone but not queries filtering only on city.
-- Index supports these queries well
CREATE INDEX idx_location ON customers(country, city);
SELECT * FROM customers WHERE country = 'Germany';
SELECT * FROM customers WHERE country = 'Germany' AND city = 'Berlin';

-- Index doesn't help this query
SELECT * FROM customers WHERE city = 'Berlin';
Covering indexes include all columns a query needs. When an index contains all requested columns, the database can satisfy the query from the index alone without accessing the table. This dramatically speeds queries.
Partial indexes reduce index size. Indexing only a subset of rows (like active users) creates smaller, faster indexes for queries that always filter on that condition.
Review and remove unused indexes. Monitor which indexes queries actually use. Unused indexes waste storage and slow writes without providing benefit. Audit indexes periodically.
Common Query Patterns and Fixes
N+1 queries multiply database round trips. Loading a list of items and then querying related data for each item individually creates N+1 queries when one or two would suffice.
# N+1 problem
orders = Order.objects.filter(status='pending')
for order in orders:
    print(order.customer.name)  # Each iteration queries customers

# Fixed with eager loading
orders = Order.objects.filter(status='pending').select_related('customer')
for order in orders:
    print(order.customer.name)  # No additional queries
Counting large tables is expensive. COUNT(*) on millions of rows takes time. Consider approximate counts, cached counts, or limiting counts to reasonable maximums.
Ordering on unindexed columns requires sorting. Large result sets sorted on columns without supporting indexes use significant resources. Add indexes for commonly used ORDER BY columns.
LIKE queries with leading wildcards can't use indexes. LIKE '%search%' must scan every row. Consider full-text search indexes for pattern matching needs.
Large IN clauses can be problematic. WHERE id IN (1, 2, 3, ... 10000) may not use indexes efficiently. Consider temporary tables or query restructuring for large value lists.
Aggregations on large datasets take time. SUM, AVG, COUNT DISTINCT, and similar operations on millions of rows require significant processing. Consider materialized views or pre-computed aggregations for frequently-run reports.
Connection Management
Database connections are expensive resources. Establishing connections requires authentication, memory allocation, and network setup. Connection pools reuse connections efficiently.
Size connection pools appropriately. Too few connections cause request queueing during load. Too many connections exhaust database memory and reduce overall performance. Monitor pool utilization and adjust based on observed patterns.
# SQLAlchemy connection pool configuration
engine = create_engine(
    DATABASE_URL,
    pool_size=20,           # Maintained connections
    max_overflow=10,        # Additional connections under load
    pool_timeout=30,        # Wait time for available connection
    pool_recycle=1800,      # Recycle connections after 30 minutes
    pool_pre_ping=True      # Verify connections before use
)
Release connections promptly. Holding connections during non-database operations wastes pool capacity. Close connections or return them to pools immediately after use.
Set connection timeouts. Long-running queries shouldn't hold connections indefinitely. Query timeouts prevent runaway queries from blocking others.
Consider connection pooling proxies. Tools like PgBouncer (PostgreSQL) or ProxySQL (MySQL) pool connections more efficiently than application-level pools. They're particularly valuable when many application instances connect to shared databases.
Monitoring and Profiling
Continuous monitoring reveals performance trends. Track query execution times, connection utilization, lock waits, and resource consumption. This data identifies problems and validates improvements.
Database-specific monitoring tools provide deep visibility. pganalyze for PostgreSQL, Percona Monitoring for MySQL, and similar tools offer query-level analysis that general-purpose monitoring misses.
Track slow query trends over time. Individual slow query logs show point-in-time problems. Historical tracking reveals whether performance is improving or degrading.
Monitor lock contention. Queries waiting for locks cause cascading delays. Identify lock-heavy operations and optimize them to reduce contention.
Alert on database resource utilization. CPU approaching 100%, memory pressure, or disk I/O saturation all indicate imminent problems. Early warning enables proactive response.
Profile queries during development. Don't wait for production to discover performance problems. Query profiling during development catches issues earlier when they're cheaper to fix.
Scaling Database Performance
Vertical scaling adds resources to existing databases. Faster CPUs, more memory, and faster storage improve capacity. This approach is simple but has limits.
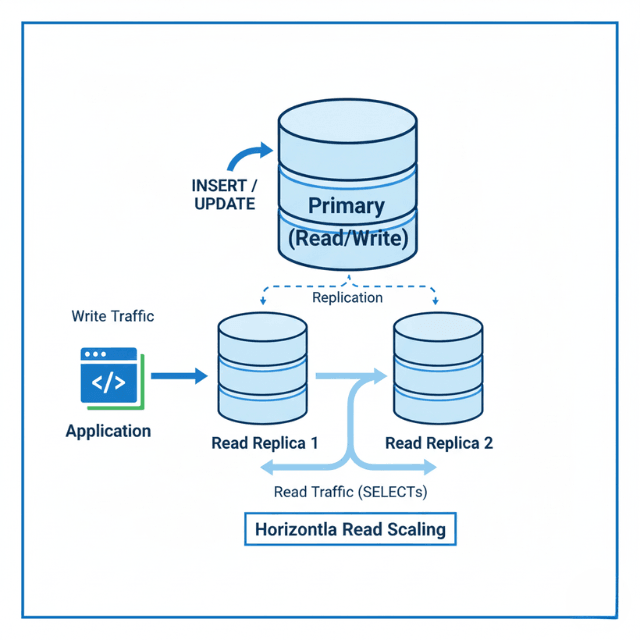
Read replicas distribute read load. Directing read queries to replicas reduces primary database load. This approach works well for read-heavy workloads.
Caching reduces database dependency. Application-level caching with Redis or Memcached stores frequently accessed data. Each cache hit eliminates a database query.
Partitioning divides large tables. Table partitioning by date or range distributes data across storage. Queries accessing specific partitions skip irrelevant data.
Sharding distributes data across database instances. Horizontal partitioning spreads load but adds architectural complexity. Consider sharding only when other approaches prove insufficient.
Denormalization trades write complexity for read speed. Storing computed values or duplicating data eliminates expensive joins. This approach works well for read-heavy, write-light patterns.
Conclusion
Database optimization isn't about chasing every millisecond—it's about eliminating the queries and patterns that visibly harm user experience. The highest-leverage work starts with measurement: enable slow query logging, understand what your ORM is actually doing, and fix the worst offenders first.
Indexing is both art and science—add indexes where they matter most, but audit them regularly to remove the unused ones. Connection management becomes critical as you scale; treat your connection pool as a precious buffer between application and database. And never stop monitoring.
Data grows, usage patterns shift, and today's efficient query may be tomorrow's bottleneck. The organizations that win on performance are those that treat database optimization as an ongoing discipline, not a one-time fix.
Frequently Asked Questions
How do I find out if a missing index is causing slow queries
Run EXPLAIN ANALYZE on the slow query. Look for "Seq Scan" (full table scan) instead of "Index Scan".
If the database is scanning millions of rows to return a few results, an index will help. Also check row estimates vs. actual rows—wildly inaccurate estimates often indicate missing statistics or indexes.
What's the N+1 query problem and how do I fix it?
N+1 happens when you query a list of items (1 query), then loop through them querying related data for each item (N queries). Example: fetching 100 orders, then querying customer details for each order individually.
Fix with eager loading: in Django, use select_related() for foreign keys; in Rails, use includes(). This retrieves all needed data in 1-2 queries instead of 101.
How do I choose between more indexes and better queries?
Start with better queries. Rewriting inefficient queries often yields bigger gains than adding indexes. Then add indexes strategically for remaining slow queries.
Remember: indexes speed reads but slow writes. For read-heavy SaaS apps, prioritize indexes on WHERE, JOIN, and ORDER BY columns. For write-heavy workloads, minimize indexes and focus on query efficiency.
Summarize this post with:
Ready to put this into production?
Our engineers have deployed these architectures across 100+ client engagements — from AWS migrations to Kubernetes clusters to AI infrastructure. We turn complex cloud challenges into measurable outcomes.