Monitoring Cloud-Native Applications
Master cloud-native observability with metrics, logs, and distributed tracing using OpenTelemetry, Prometheus, and Grafana to improve reliability and performance.
Introduction
Cloud native observability provides visibility into distributed systems through metrics, logs, and traces, enabling teams to understand why systems behave as they do, not just when they fail. As microservices architectures grow to hundreds of services across ephemeral containers, observability becomes essential for debugging, performance optimization, and reliability. This guide covers the three pillars, OpenTelemetry instrumentation, distributed tracing, and best practices for production observability.
The Three Pillars
Metrics quantify system behavior through time-series data. Prometheus has become the standard for cloud native metrics, using a pull model to scrape endpoints exposed by applications. Kubernetes service discovery automatically finds targets. Key metrics include request rates, error rates, and latency distributions following the RED method. Metrics enable dashboards, alerting, and capacity planning.
Logs provide detailed event records. Structured logging using JSON enables efficient querying and correlation. Centralized aggregation via Fluentd or Loki collects logs from distributed containers, enriching them with Kubernetes metadata. Including trace IDs in log entries enables correlating logs with specific distributed transactions, transforming debugging from guesswork into systematic investigation.
Distributed tracing tracks requests flowing through microservices. Each trace receives a unique ID propagated across service calls. OpenTelemetry provides vendor-neutral instrumentation. Jaeger or Tempo visualize complete request paths. Tracing reveals performance bottlenecks, service dependencies, and error propagation impossible to understand from metrics alone.
These pillars are complementary. Metrics identify when problems occur. Traces show where problems happen in request flows. Logs provide detailed context about what happened. Effective observability integrates all three rather than treating them as separate concerns.
OpenTelemetry
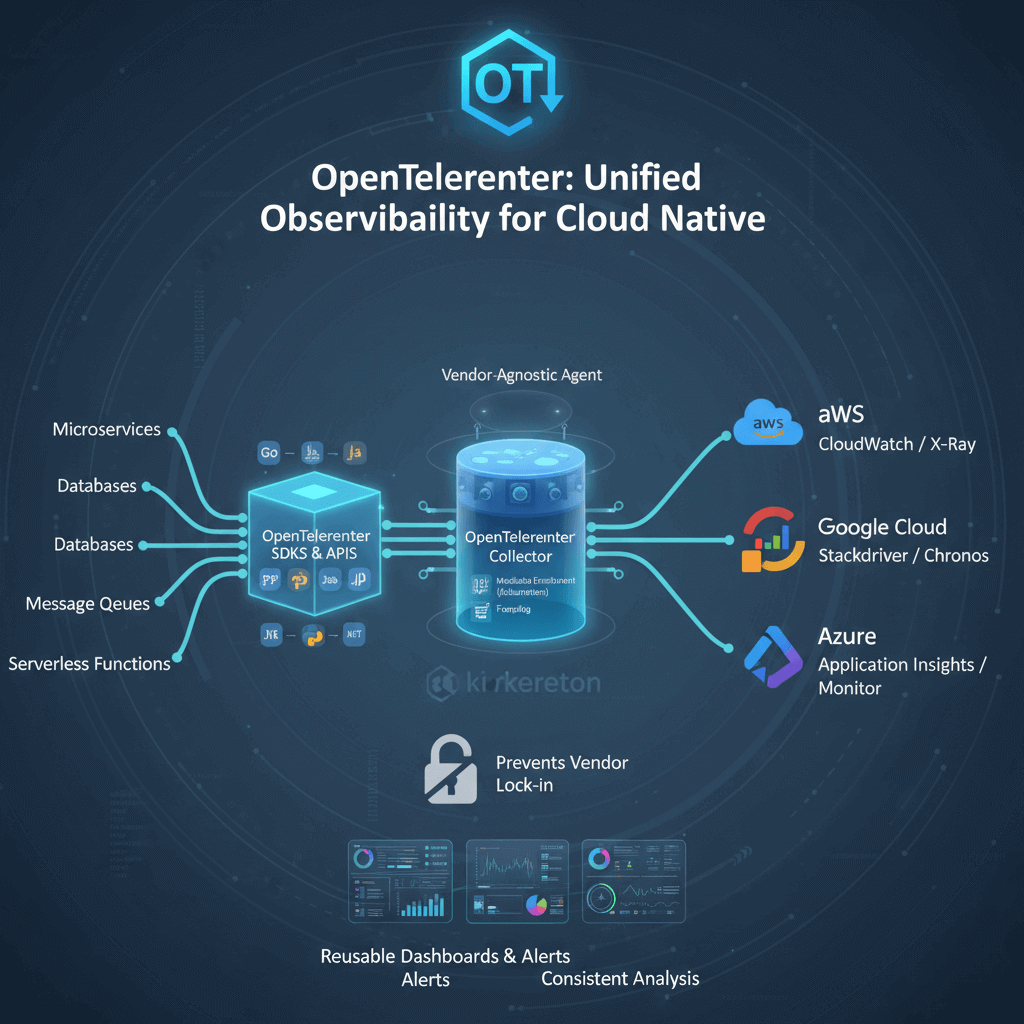
OpenTelemetry provides the industry standard for instrumenting cloud native applications (refer to the OpenTelemetry official documentation). As a CNCF project formed from merging OpenTracing and OpenCensus, OpenTelemetry offers vendor-neutral APIs, SDKs, and tools for collecting telemetry data.
Benefits include separation of instrumentation from backends. Instrument applications once using OpenTelemetry, then configure exporters sending data to any compatible backend. This prevents vendor lock-in while enabling multi-backend observability. Automatic instrumentation libraries inject observability into popular frameworks without code changes.
Core components include the specification defining APIs and semantic conventions ensuring consistent telemetry across languages. Language-specific SDKs implement the specification in Go, Java, Python, JavaScript, .NET, and other languages. The OpenTelemetry Collector provides a vendor-agnostic agent for receiving, processing, and exporting telemetry data.
Semantic conventions standardize attribute names and values for common operations. Instead of each organization inventing attribute names, semantic conventions ensure consistency. This standardization enables reusable dashboards, alerts, and analysis across different services.
For platform engineers deploying the OpenTelemetry Collector as a daemonset or sidecar in Kubernetes provides a centralized point for collecting, enriching, and routing telemetry data. The collector can perform sampling, add Kubernetes metadata, convert between formats, and export to multiple backends.
Distributed Tracing
Distributed tracing is the most powerful yet most challenging pillar. When a request enters your system, the first instrumented service generates a unique trace ID and a span representing its work. As that service calls other services, it propagates the trace ID through request headers. Each downstream service creates its own spans, linking them to the trace ID and parent span.
Spans contain timing information including start time and duration, operation metadata including service name and HTTP endpoint, tags and attributes providing context, and relationships to parent spans and child spans. Modern implementations also support span events marking notable occurrences during the span.
Context propagation requires trace context propagating across all service boundaries including HTTP headers for REST APIs, gRPC metadata for gRPC services, message attributes for asynchronous messaging, and correlation IDs in database connections. The W3C Trace Context standard specifies the format for propagating context, ensuring interoperability.
Sampling strategies manage data volume. Head-based sampling decides at the start of a trace, typically using a percentage. Tail-based sampling decides after seeing the entire trace, enabling intelligent sampling of errors, slow requests, or specific user sessions while dropping routine successful requests.
Implementation requires instrumenting all services, even third-party services where possible. Popular frameworks like Spring Boot, Django, and Express have OpenTelemetry integrations providing automatic tracing with minimal code changes. Service meshes like Istio provide automatic distributed tracing at the network layer without application code changes.
Metrics Collection
Prometheus architecture uses a pull-based approach where Prometheus servers periodically scrape metrics endpoints exposed by applications. This inversion of control simplifies networking in dynamic Kubernetes environments. Applications expose an HTTP endpoint (typically /metrics) returning metric names, labels, values, and timestamps in human-readable text format.
Metric types include Counters tracking cumulative values that only increase, useful for calculating rates of change. Gauges represent point-in-time values that can increase or decrease, useful for dashboards showing current state. Histograms bucket observations into configurable ranges, enabling percentile calculations.
PromQL enables sophisticated metric analysis. Calculate rates from counters, compute percentiles from histograms, aggregate across multiple series, join different metric sets, and create recording rules for frequently-used expensive queries. Mastering PromQL is essential for SREs working with Prometheus-based observability.
Scaling Prometheus requires solutions beyond single instances, especially in environments using Kubernetes autoscaling strategies on AWS.. Thanos adds long-term storage, global querying across multiple Prometheus instances, and downsampling for cost-effective retention aligned with cost-effective Kubernetes management strategies. Cortex offers multi-tenant, horizontally scalable Prometheus-as-a-Service. VictoriaMetrics provides a drop-in Prometheus replacement with better performance.
Logging Strategies
Structured logging emits JSON-formatted logs with consistent field names. Structured logs enable efficient querying, aggregation, and correlation without fragile regex parsing. A well-structured log entry includes timestamp, log level, message, service name, trace ID and span ID for correlation, Kubernetes metadata, and custom contextual fields.
Centralized aggregation collects logs from ephemeral containers before pods are deleted. Fluentd and Fluent Bit deployed as DaemonSets collect logs from all nodes, enriching them with Kubernetes metadata. This context enables efficient filtering and correlation across distributed services.
Loki offers a cost-effective alternative to Elasticsearch. Instead of indexing log content, Loki only indexes metadata labels, dramatically reducing storage costs and resource requirements. Logs are queried using LogQL, which filters by labels then performs full-text search on matching log streams.
Log correlation is the most powerful logging practice. Include trace IDs in every log entry. When troubleshooting specific user requests, search logs for trace IDs and see all log entries from every service involved in handling that request, ordered chronologically. This transforms debugging from guesswork into systematic investigation.
Observability Platforms
Prometheus and Grafana form the foundation of most cloud native observability stacks. Prometheus provides metrics collection and storage. Grafana offers visualization and dashboarding with support for multiple data sources. Pre-built dashboards for Kubernetes and common infrastructure components speed up implementation.
Commercial platforms like Datadog, New Relic, and Dynatrace offer integrated metrics, logs, and traces with advanced features including AI-powered anomaly detection, automatic instrumentation, and business analytics. These platforms reduce operational overhead but introduce vendor dependencies and potentially significant costs at scale.
Open source stacks combine Prometheus for metrics, Loki for logs, Jaeger for traces, and Grafana for visualization. This stack provides comprehensive observability without vendor lock-in, though it requires significant operational investment to deploy and maintain reliably.
Observability Best Practices
Instrument early - Add observability to applications from the beginning rather than retrofitting later. Use OpenTelemetry for standardized instrumentation. Implement the RED method for request-driven services or USE method for resource-driven services. Establish baseline performance through percentiles rather than averages, as p95/p99 latency reveals problems averages obscure.
High-cardinality observability enables answering specific questions. Tag metrics and traces with service, endpoint, availability zone, customer tier, deployment version, and feature flags. This granularity enables drilling down from aggregate issues to specific root causes. Ensure your observability platform supports high-cardinality without exploding storage costs.
SLO-based alerting focuses alerts on user impact rather than arbitrary metric thresholds. Define Service Level Indicators measuring user experience. Set Service Level Objectives defining acceptable performance. Alert when error budgets are being consumed, balancing detection speed with false positive rate.
Correlation between observability signals is critical. Use trace IDs connecting logs to traces to specific distributed transactions. Correlate deployment events with metric changes to understand release impact. Link alerts to relevant dashboards and runbooks for faster incident response.
Conclusion
Cloud native observability through metrics, logs, and traces provides essential visibility into distributed systems. OpenTelemetry has emerged as the standard instrumentation framework, offering vendor neutrality and consistent telemetry. Distributed tracing reveals request flows and dependencies impossible to understand from metrics alone.
Success requires instrumenting applications early, establishing high-cardinality observability, implementing SLO-based alerting, and correlating signals across the three pillars. Organizations mastering cloud native observability achieve faster incident resolution, better capacity planning, and superior user experiences through operational excellence that directly impacts business outcomes.