Frontend vs Backend Bottlenecks in SaaS Applications
Learn to identify frontend vs backend bottlenecks in SaaS applications. Diagnostic tools, common fixes, and systematic troubleshooting for faster performance.
TL;DR
- Performance issues hide in multiple layers: Frontend (browser), network, backend (server), database, and external services all contribute. Misdiagnosing the bottleneck wastes optimization effort—accurate identification is the first step.
- Frontend bottlenecks manifest as fast Time to First Byte (TTFB) but slow perceived loading. Symptoms: large JavaScript bundles, long main-thread tasks, inefficient rendering, heavy images, and third-party scripts. Use Chrome DevTools Performance tab, Lighthouse, and Real User Monitoring (RUM) to diagnose.
- Backend bottlenecks show as slow TTFB. Common culprits: slow database queries (missing indexes, full table scans), N+1 query patterns, synchronous external API calls, insufficient connection pooling, and CPU/memory pressure. Use APM tools (Datadog, New Relic), distributed tracing, and slow query logs.
- Diagnostic tools by layer:
- Frontend: Chrome DevTools (Performance, Network), Lighthouse, WebPageTest, RUM tools.
- Backend: APM, distributed tracing (Jaeger, OpenTelemetry), database slow query logs, profilers (cProfile, clinic.js).
- End-to-end: Real User Monitoring connects user experience to backend traces.
- Common fixes by layer:
- Frontend: Code splitting, lazy loading, compression, caching, render optimization, reduce third-party scripts.
- Backend: Add missing indexes, eager loading for N+1 queries, caching (Redis), async processing for slow operations, connection pooling, timeouts + circuit breakers for external calls.
- Systematic process: Start with user-reported symptoms → measure TTFB → determine frontend vs backend → profile the specific layer → implement targeted fix → verify improvement. Avoid shotgun approaches that guess at the problem.
When your application feels slow, the first challenge is locating the problem. Performance issues can originate in browser-side code, server-side processing, database operations, network transit, or third-party services. Misdiagnosing the bottleneck leads to wasted optimization effort. Accurate identification enables targeted fixes that produce real improvement.
Understanding the Performance Stack
Modern SaaS applications involve multiple layers between user action and visible response. Each layer can introduce performance problems. Understanding this stack provides the framework for diagnosis.
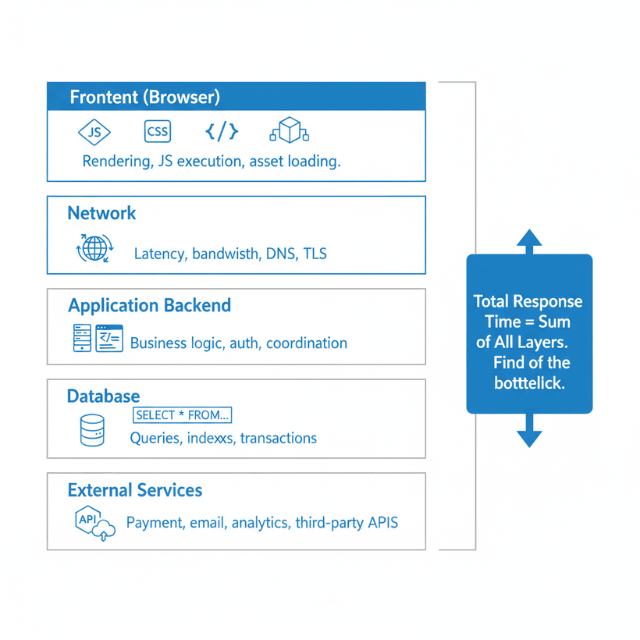
The frontend layer runs in users' browsers. JavaScript code executes, CSS styles render, and the DOM updates to reflect application state. Heavy computation, inefficient rendering, or large asset downloads all slow frontend performance.
The network layer connects browsers to servers. Requests traverse internet infrastructure, potentially crossing continents. Network latency, bandwidth limitations, and connection quality all affect performance.
The application backend processes requests. Servers execute business logic, validate inputs, apply authorization, and coordinate responses. Complex processing, inefficient algorithms, or resource contention slow backend performance.
The database layer stores and retrieves data. Queries fetch information, transactions maintain consistency, and indexes accelerate lookups. Slow queries, missing indexes, or lock contention create database bottlenecks.
External services add dependencies. Payment processors, email services, analytics platforms, and other integrations extend your application. Their performance directly affects yours.
Each layer contributes to total response time. A user waiting three seconds might be experiencing one second of frontend rendering, 500 milliseconds of network latency, one second of backend processing, and 500 milliseconds of database queries. Identifying which layer dominates guides optimization priority.
Identifying Frontend Bottlenecks
Frontend bottlenecks manifest as delays between browser receiving data and users seeing results. The network request completes quickly, but the page still feels slow. This pattern indicates browser-side problems.
Large JavaScript bundles delay initial page load. Before browsers can render interactive content, they must download, parse, and execute JavaScript. Bundles measured in megabytes take seconds to process even on fast connections.
Long JavaScript execution blocks the main thread. While JavaScript runs, browsers cannot respond to user input or update displays. Complex calculations, inefficient loops, or excessive DOM manipulation freeze interfaces.
Inefficient rendering causes janky experiences. Re-rendering large component trees on minor data changes wastes browser resources. Virtual DOM diffing takes time even when actual changes are minimal.
Heavy images and media slow visual content. Unoptimized images download slowly and consume memory during rendering. Large hero images or galleries particularly affect perceived performance.
Third-party scripts add overhead. Analytics, advertising, chat widgets, and social sharing buttons each add JavaScript to execute. Cumulative impact from multiple third-party scripts can be substantial.
CSS complexity affects render performance. Complex selectors, unused styles, and excessive style recalculation slow browsers. Layout thrashing from JavaScript reading layout properties and writing style changes creates particular problems.
Symptoms of frontend bottlenecks include fast Time to First Byte (TTFB) but slow Largest Contentful Paint (LCP), high First Input Delay (FID), and browser profiler showing long JavaScript tasks.
Identifying Backend Bottlenecks
Backend bottlenecks manifest as slow server response times. Users wait for network requests to complete rather than for browsers to process results. Server-side investigation reveals the problem source.
Slow database queries dominate many backend bottlenecks. Queries scanning large tables, missing appropriate indexes, or performing complex joins consume time. A single slow query can make entire features feel sluggish.
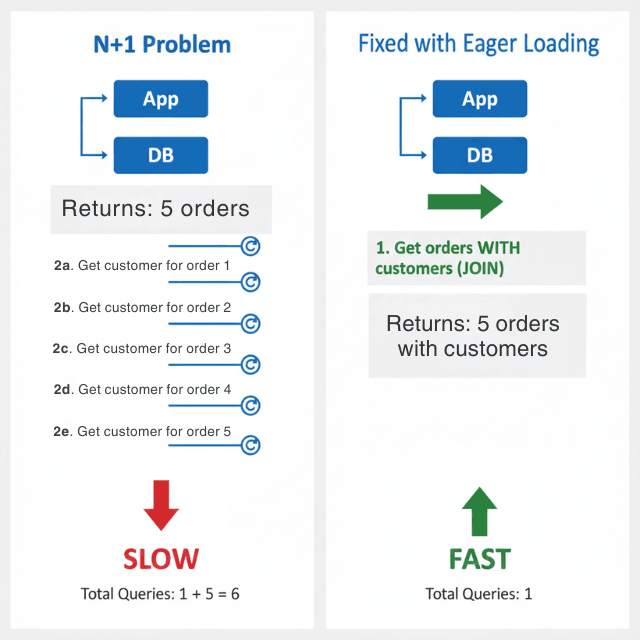
N+1 query patterns multiply database round trips. Fetching a list and then querying related data for each item individually creates excessive database communication. What could be one or two queries becomes dozens or hundreds.
Synchronous external service calls add their latency to yours. If your application calls a payment API that takes 500 milliseconds, your response takes at least that long. Multiple external calls in sequence compound delays.
Insufficient connection pooling creates connection overhead. Establishing database connections is expensive. Without pooling, each request pays this overhead. Pool exhaustion causes request queueing.
CPU-intensive operations block request processing. Complex calculations, image manipulation, or data transformation consume processing time. Without async processing, these operations delay responses.
Memory pressure degrades performance. Applications approaching memory limits trigger garbage collection pauses. Memory leaks cause gradual performance degradation until restart.
Symptoms of backend bottlenecks include slow TTFB, high server response times in APM tools, and CPU or memory pressure visible in infrastructure monitoring.
Diagnostic Tools and Techniques
Browser developer tools reveal frontend performance. Chrome's Performance tab records page loading and interaction, showing JavaScript execution, rendering, and painting timelines. The Network tab shows asset download times. Lighthouse provides automated performance audits.
Real User Monitoring captures actual user experiences. RUM tools collect performance data from production users across diverse devices and network conditions. This data represents real-world performance more accurately than lab testing.
Application Performance Monitoring tracks backend behavior. APM tools like Datadog, New Relic, or Jaeger trace requests through your stack. They reveal time spent in different services, database query durations, and external call latencies.
Distributed tracing connects frontend and backend. End-to-end traces show total request lifecycle from browser through all backend services. This comprehensive view identifies which component contributes most to slow experiences.
Database query logs reveal slow queries. Enable slow query logging with appropriate thresholds. Review logged queries for optimization opportunities. Use EXPLAIN to understand query execution plans.
Load testing reveals bottlenecks under stress. Synthetic load tests push your application beyond normal traffic. Bottlenecks that remain invisible under light load emerge under stress.
Profiling provides granular detail. Language-specific profilers (Python's cProfile, Node's clinic.js, etc.) reveal function-level performance characteristics. Use profiling when aggregated metrics don't explain observed problems.
Common Frontend Fixes
Code splitting reduces initial bundle size. Load only the JavaScript needed for current functionality. Route-based splitting loads each page's code separately. Dynamic imports defer component loading until needed.
Lazy loading defers offscreen content. Images below the visible viewport don't need to load immediately. Media that users might never scroll to shouldn't block initial rendering. Implement intersection observers to trigger loading as content approaches visibility.
Compression reduces transfer sizes. Enable gzip or brotli compression for text assets. Modern bundlers can minify JavaScript and CSS. Image compression tools reduce file sizes without visible quality loss.
Caching eliminates repeat downloads. Set appropriate cache headers for static assets. Use content-hashed filenames to enable long cache lifetimes while ensuring updates propagate. Service workers enable sophisticated offline caching.
Optimize rendering performance. Memoize expensive calculations. Virtualize long lists to render only visible items. Use React.memo, Vue computed properties, or equivalent patterns to prevent unnecessary re-renders.
Reduce third-party script impact. Audit third-party scripts for necessity. Load non-critical scripts asynchronously. Consider self-hosting critical dependencies to gain control over delivery.
Use modern image formats. WebP and AVIF provide better compression than JPEG and PNG. Implement responsive images that serve appropriate sizes for different screen widths.
Common Backend Fixes
Add database indexes for slow queries. Analyze query execution plans to identify missing indexes. Add indexes on columns used in WHERE clauses, JOIN conditions, and ORDER BY statements. Monitor index usage to avoid unused indexes consuming resources.
Implement eager loading to fix N+1 queries. Most ORMs provide mechanisms to load related data in single queries. Use Rails includes(), Django prefetch_related(), or equivalent patterns to eliminate per-item queries.
Add caching for repeated operations. Cache database query results for data that doesn't change frequently. Cache computed results that are expensive to generate. Implement cache invalidation carefully to maintain data accuracy.
Use async processing for slow operations. Move email sending, report generation, image processing, and similar operations to background job queues. Return immediate acknowledgment to users while work completes asynchronously.
Implement connection pooling. Configure database connection pools sized appropriately for your workload. Ensure connections are released properly after use. Monitor pool utilization and adjust sizing based on observed patterns.
Set timeouts on external service calls. Don't wait indefinitely for unresponsive services. Implement circuit breakers that fail fast when services are down. Consider fallback behaviors that provide degraded functionality.
Optimize algorithms and data structures. Profile code to identify CPU-intensive functions. Review algorithmic complexity. Sometimes simple changes like switching data structures or algorithm approaches produce dramatic improvements.
Systematic Troubleshooting Process
Start with user-reported symptoms. What specific action feels slow? Consistent reproduction helps isolate problems. Vague reports of "slowness" are harder to diagnose than specific complaints.
Measure end-to-end response time. Establish baseline measurements for the slow operation. Quantify the problem before attempting fixes.
Determine frontend versus backend responsibility. Check TTFB for the relevant requests. Fast TTFB with slow perceived performance indicates frontend issues. Slow TTFB indicates backend issues.
For frontend issues, profile browser performance. Record the slow interaction in Chrome DevTools. Identify long tasks, rendering delays, or asset loading problems. Focus optimization on the largest contributors.
For backend issues, examine request traces. Follow the request through your application stack. Identify which component consumes the most time. Database queries, external calls, and CPU-intensive processing are common culprits.
Implement targeted fixes. Address the identified bottleneck specifically. Resist the temptation to make broad changes that obscure cause and effect.
Verify improvement. Measure performance after changes. Confirm that the specific problem improved. Watch for regressions in other areas.
Document findings. Record what you learned for future reference. Share knowledge with team members. Build organizational understanding of system performance characteristics.
Conclusion
Performance troubleshooting is detective work. The symptom is "slow," but the cause could be anything from a missing database index to an oversized JavaScript bundle to a sluggish third-party API.
The most costly optimization mistakes happen when you fix the wrong layer—optimizing database queries when the real problem is frontend rendering, or adding CDN caching when the backend is CPU-bound. Success requires systematic diagnosis: measure, isolate, profile, fix, verify. Use TTFB as your first filter. Fast TTFB = frontend issue. Slow TTFB = backend issue. Then dive deeper with layer-appropriate tools.
Build a toolkit of diagnostic techniques, document your findings, and share knowledge across your team. The goal isn't just faster performance—it's the ability to find and fix any performance problem, anywhere in the stack, with confidence and speed.
Frequently Asked Questions
How do I know if a performance problem is frontend or backend?
Check Time to First Byte (TTFB). If TTFB is fast (under 200ms) but the page still feels slow, the bottleneck is likely frontend—browser parsing, JavaScript execution, rendering. If TTFB is slow (over 500ms), the bottleneck is likely backend—database queries, external calls, or server processing.
Use browser DevTools Network tab to see TTFB, or APM tools to trace server-side timing. RUM tools can correlate user-perceived slowness with backend metrics.
What's the most common misdiagnosed bottleneck?
Confusing slow database queries with slow network. Teams often blame "the database" when the real problem is an N+1 query pattern that multiplies network round trips.
A single slow query might take 200ms, but 100 queries executed sequentially can take 5 seconds—yet each individual query is "fast." Proper instrumentation (APM, query logs) reveals the pattern. Always measure total time, not individual operation times.
How do I investigate when the bottleneck shifts under load?
Bottlenecks can be latency-based (slow at low traffic) or throughput-based (slow under high load). Test both:
- Single user: Use browser DevTools or
curlwith timing to measure baseline latency. - Under load: Use load testing tools (k6, JMeter) to simulate concurrent users. Monitor resource utilization (CPU, memory, database connections) during the test. A system that's fast for one user but slow under load usually has a resource exhaustion issue—connection pool limits, database throttling, or insufficient auto-scaling thresholds. Profile under both conditions.
Summarize this post with:
Ready to put this into production?
Our engineers have deployed these architectures across 100+ client engagements — from AWS migrations to Kubernetes clusters to AI infrastructure. We turn complex cloud challenges into measurable outcomes.