Frontend Performance Optimization for Faster Load Times and Better UX
Master frontend performance optimization for faster load times and better UX. Learn Core Web Vitals, JavaScript bundle reduction, image optimization, and caching strategies.

TL;DR
- Core Web Vitals define user experience: Google's metrics (LCP <2.5s, FID <100ms, CLS <0.1) directly impact both user perception and search rankings. Measure them with PageSpeed Insights and Chrome UX Report.
- JavaScript is your biggest performance lever: Reduce bundles with code splitting (load by route), tree shaking (remove unused code), and lazy loading (defer non-critical features). Analyze bundle composition with tools like webpack-bundle-analyzer—you'll often find large dependencies that can be replaced.
- Images dominate page weight: Use modern formats (WebP, AVIF) with fallbacks. Implement responsive images (
srcset) to serve appropriate sizes. Lazy load below-the-fold images withloading="lazy". Preload critical hero images. - Optimize the critical rendering path: Inline critical CSS, defer non-critical JavaScript with
defer/async, and minimize render-blocking resources. Server-side rendering (SSR) delivers content faster than client-only rendering. - Runtime performance matters after load: Avoid long JavaScript tasks (>50ms) that block the main thread. Virtualize long lists, debounce expensive handlers, and use Web Workers for heavy computation. Monitor frame rates for 60fps smoothness.
- Cache aggressively with CDNs: Version assets with content hashes for long-lived caching (
app.a1b2c3.js). Distribute via CDN for global low latency. Use service workers for offline support and faster repeat visits. - Measure continuously with RUM: Real User Monitoring captures actual performance across devices and networks. Set performance budgets in CI/CD to prevent regressions.
Frontend performance shapes first impressions. Before users experience your features, they experience your load time. A fast, responsive interface signals quality. A slow, janky experience suggests problems throughout the product. Frontend optimization directly improves user perception and engagement.
Core Web Vitals and Why They Matter
Google's Core Web Vitals measure real user experience. These metrics influence search rankings and represent what users actually experience. Meeting these thresholds should be your baseline target.
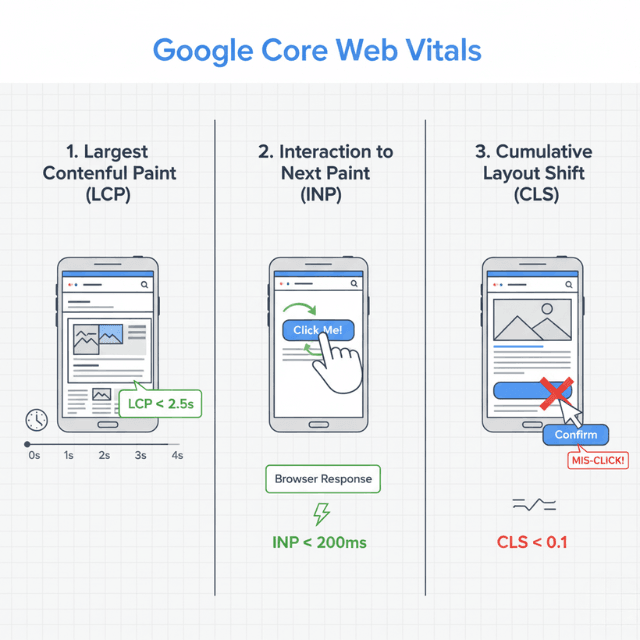
Largest Contentful Paint (LCP) measures loading performance. It marks when the main content becomes visible. Good LCP is under 2.5 seconds. This metric captures perceived loading speed better than technical metrics alone.
First Input Delay (FID) measures interactivity. It records the time between a user's first interaction and browser response. Good FID is under 100 milliseconds. High FID usually indicates JavaScript blocking the main thread.
Cumulative Layout Shift (CLS) measures visual stability. It quantifies unexpected layout movements during page load. Good CLS is under 0.1. Layout shifts frustrate users who may click wrong elements or lose reading position.
Interaction to Next Paint (INP) is replacing FID. INP measures responsiveness throughout the session, not just first interaction. It provides a more complete picture of interactivity.
These metrics combine technical and perceptual factors. A page can load quickly by technical measures but still score poorly on Core Web Vitals. Optimization must target what users experience, not just what servers measure.
Tools like PageSpeed Insights, Lighthouse, and Chrome DevTools measure these metrics. Field data from Chrome User Experience Report shows real user results, while lab data provides controlled testing.
Reducing JavaScript Bundle Size
JavaScript is often the largest payload affecting SaaS applications. Every kilobyte must be downloaded, parsed, and executed before applications become interactive.
Code splitting loads only what's needed. Instead of one large bundle containing all code, split by route or feature. Users downloading the dashboard don't need checkout code.
// Route-based code splitting with React
import { lazy, Suspense } from 'react';

const Dashboard = lazy(() => import('./Dashboard'));
const Settings = lazy(() => import('./Settings'));

function App() {
  return (
    <Suspense fallback={<Loading />}>
      <Routes>
        <Route path="/dashboard" element={<Dashboard />} />
        <Route path="/settings" element={<Settings />} />
      </Routes>
    </Suspense>
  );
}
Tree shaking removes unused code. Modern bundlers eliminate code that's imported but never used. Ensure your dependencies support tree shaking through ES modules.
Analyze bundle composition. Tools like webpack-bundle-analyzer visualize what's in your bundles. Often, large dependencies can be replaced with smaller alternatives or removed entirely.
Lazy load non-critical components. Features users might not need immediately can load on demand. Dynamic imports fetch code when users navigate to features.
Evaluate dependency choices. Some popular libraries are surprisingly large. Lodash imports, date libraries, and UI frameworks often have lighter alternatives. Consider bundle impact when adding dependencies.
Minification reduces code size. Production builds should minify JavaScript, removing whitespace and shortening variable names. Enable production mode in your build tools.
Compression further reduces transfer size. Gzip or Brotli compression typically reduces JavaScript size by 70-80%. Verify your server and CDN serve compressed assets.
Optimizing Image and Media Delivery
Images often account for most page weight. Unoptimized images waste bandwidth and slow page loading. Modern techniques dramatically reduce image impact.
Use modern image formats. WebP offers 25-35% smaller files than JPEG at equivalent quality. AVIF provides even better compression. Serve modern formats with fallbacks for older browsers.
<picture>
  <source srcset="image.avif" type="image/avif">
  <source srcset="image.webp" type="image/webp">
  <img src="image.jpg" alt="Description">
</picture>
Implement responsive images. Serving 4K images to mobile phones wastes bandwidth. Use srcset to provide appropriately sized images for different screen sizes.
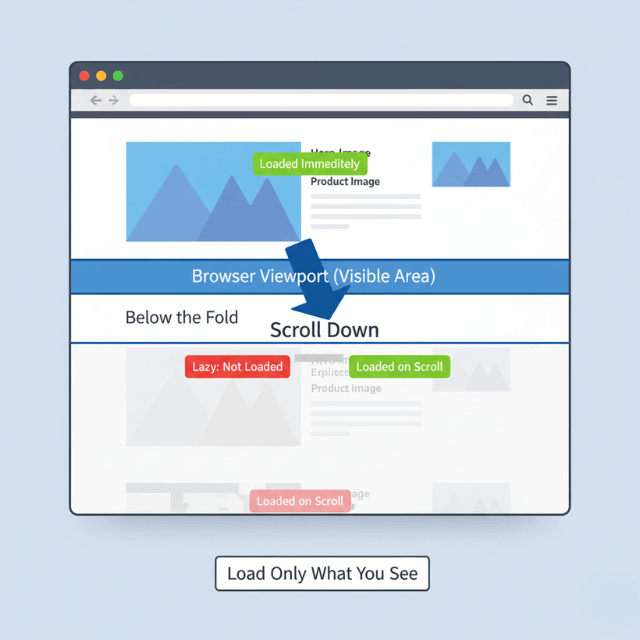
Lazy load images below the fold. Images not immediately visible don't need to load immediately. Native lazy loading with loading="lazy" defers offscreen images.
Compress images appropriately. Lossy compression reduces file size significantly with minimal visible quality loss. Tools like ImageOptim or squoosh optimize images for web delivery.
Consider CSS for simple graphics. Gradients, shapes, and icons often render more efficiently as CSS than as images. SVG provides scalable graphics with small file sizes.
Preload critical images. The hero image users see first should load immediately. Preload hints tell browsers to fetch these images early.
<link rel="preload" as="image" href="hero.webp">
Critical Rendering Path Optimization
The critical rendering path determines how quickly content appears. Optimizing this path reduces time to first meaningful paint.
Inline critical CSS. CSS needed for above-the-fold content should be inlined in HTML. This eliminates a render-blocking request. Load remaining CSS asynchronously.
Defer non-critical JavaScript. Scripts that don't affect initial rendering should use defer or async attributes. This allows HTML parsing to continue while scripts load.
<!-- Render-blocking: avoid for non-critical scripts -->
<script src="analytics.js"></script>

<!-- Deferred: executes after parsing, maintains order -->
<script defer src="app.js"></script>

<!-- Async: executes when ready, no order guarantee -->
<script async src="analytics.js"></script>
Minimize render-blocking resources. Each CSS file and synchronous script blocks rendering. Combine files where possible. Load non-critical resources after initial render.
Reduce DOM size. Large DOM trees slow parsing and updates. Virtualize long lists. Remove unnecessary wrapper elements. Target fewer than 1,500 DOM nodes.
Optimize web fonts. Fonts can delay text rendering. Use font-display: swap to show text immediately with fallback fonts. Preload critical fonts. Consider system fonts for body text.
Server-side rendering improves initial content visibility. SSR sends HTML with content already rendered. Users see content faster even while JavaScript loads.
Runtime Performance
Loading is only part of frontend performance. Runtime performance affects how the application feels during use.
Avoid long-running JavaScript tasks. Tasks exceeding 50ms block the main thread, making the UI unresponsive. Break large tasks into smaller chunks using requestIdleCallback or setTimeout.
Optimize component rendering. In React, use React.memo to prevent unnecessary re-renders. Use useMemo and useCallback to memoize expensive computations and callbacks.
// Memoize expensive computation
const expensiveResult = useMemo(() => {
  return computeExpensiveValue(data);
}, [data]);

// Prevent unnecessary re-renders
const MemoizedComponent = React.memo(function Component({ prop }) {
  return <div>{prop}</div>;
});
Virtualize long lists. Rendering thousands of DOM elements consumes memory and slows updates. Virtual scrolling renders only visible items plus a small buffer.
Debounce and throttle expensive handlers. Scroll, resize, and input handlers that trigger complex work should limit execution frequency.
Monitor frame rates. Animations and updates should maintain 60 fps. Drops below 60 fps create visible jank. Chrome DevTools Performance panel helps identify frame rate problems.
Use Web Workers for heavy computation. CPU-intensive operations can move to background threads, keeping the main thread responsive for user interaction.
Caching and CDN Strategies
Effective caching eliminates repeat downloads. Returning users benefit from locally cached assets. CDN distribution reduces latency for users everywhere.
Configure long cache lifetimes for versioned assets. Files with content hashes in names (app.a1b2c3.js) can cache for a year. The hash changes when content changes.
# Nginx cache configuration
location /assets/ {
    expires 1y;
    add_header Cache-Control "public, immutable";
}
Use ETags and Last-Modified headers. These enable conditional requests that verify cache freshness without re-downloading unchanged content.
Implement service workers for offline support. Service workers intercept network requests and can serve cached responses. This capability improves performance and enables offline functionality.
Distribute content via CDN. CDN caching assets at edge locations worldwide. Users fetch from nearby servers rather than your origin. This reduces latency significantly for global audiences.
Preconnect to required origins. Preconnect hints establish connections early. This reduces latency when browsers later need to fetch resources from those origins.
<link rel="preconnect" href="https://cdn.example.com">
<link rel="preconnect" href="https://api.example.com">
Measuring and Monitoring
Continuous measurement ensures performance doesn't degrade. Development optimizations mean nothing if production regresses.
Use Real User Monitoring (RUM). RUM captures performance data from actual users across diverse devices and networks. This data represents real-world performance, not lab conditions.
Monitor Core Web Vitals in production. Track LCP, FID/INP, and CLS over time. Segment by page, device type, and geography to understand performance across your user base.
Set performance budgets. Define thresholds for bundle sizes, page weights, and Core Web Vitals. Integrate budget checks into CI/CD to prevent regressions.
Run Lighthouse in CI. Automated Lighthouse tests on every deployment catch performance regressions before they reach users.
Profile with Chrome DevTools. The Performance panel records page loading and interaction. Identify specific bottlenecks in rendering, scripting, and layout.
Compare against competitors. Tools like WebPageTest enable competitive benchmarking. Understanding how your performance compares provides context for priorities.
Conclusion
Frontend performance is not a one-time optimization—it's a continuous commitment to your users. Every millisecond saved, every kilobyte trimmed, and every layout stabilized directly translates to better user experience, higher engagement, and improved conversion.
The tools are mature: Core Web Vitals provide clear targets, modern bundlers enable fine-grained code control, and CDNs distribute content globally. But the real work lies in establishing performance as a first-class engineering concern—measured in CI/CD, tracked in dashboards, and owned by every developer shipping code.
Start with the highest-impact areas: reduce JavaScript payload, optimize critical images, and fix the worst Core Web Vitals. Then iterate. Users notice when you care about speed. They reward you with engagement and loyalty.
Frequently Asked Questions
How do I prioritize which Core Web Vitals to fix first?
Focus on LCP (loading) first—it's what users experience immediately. Then tackle INP (interactivity)—nothing frustrates more than a page that's loaded but unresponsive.
Finally, address CLS (layout shift)—it's often easier to fix (set explicit dimensions for images/ads) and completes the user experience. Use field data (Chrome UX Report) to know what real users actually experience, not just lab tests.
What's the most common JavaScript mistake hurting performance?
Not code splitting. Shipping a single massive bundle containing all application code—including features users may never visit—forces everyone to download, parse, and execute unnecessary JavaScript.
The fix: implement route-based code splitting (load only what the current route needs) and lazy load heavy components (charts, editors) until they're actually requested.
How do modern image formats compare?
WebP (supported in all modern browsers) reduces size 25-35% compared to JPEG/PNG. AVIF offers even better compression (50% smaller than JPEG) but with slightly less browser support.
Use the <picture> element with multiple sources: serve AVIF first, fall back to WebP, then original format. This ensures optimal compression while maintaining compatibility. Always compress images before deployment—lossy compression is almost invisible to users but halves file sizes.
Summarize this post with:
Ready to put this into production?
Our engineers have deployed these architectures across 100+ client engagements — from AWS migrations to Kubernetes clusters to AI infrastructure. We turn complex cloud challenges into measurable outcomes.