Maintain 99.9% Uptime with GCP Monitoring
Monitor LLM deployments with Google Cloud Operations for reliability and performance. Track metrics, set up alerts, and debug production issues with unified observability across Vertex AI, GKE, and Cloud Run.
TLDR;
- 150 MB/month free tier covers metrics for most small-to-medium LLM deployments
- Three-tier alerting prevents issues: critical (page), warning (Slack), info (daily digest)
- Cloud Trace tracks requests across services with OpenTelemetry integration
- Budget alerts at 50%, 90%, and 100% thresholds prevent cost overruns
Production LLM deployments face constant challenges. Latency spikes affect user experience. Error rates climb unexpectedly.
GPU memory exhausts during peak traffic. Without proper monitoring, you discover these issues only when customers complain or revenue drops.
Google Cloud Operations (formerly Stackdriver) provides unified observability for your entire LLM stack. Monitor Vertex AI endpoints, track GKE pod metrics, analyze Cloud Run performance, and correlate events across services from a single platform.
Cloud Monitoring collects metrics automatically from managed services while custom metrics capture application-specific data like token generation rates and prompt processing times.
This guide shows you how to implement production-grade monitoring for LLM deployments. You'll learn to track essential metrics, configure alerting policies, analyze logs at scale, and optimize costs through intelligent observability.
Whether serving models on Vertex AI, GKE, or Cloud Run, these monitoring patterns help you maintain 99.9% uptime and deliver consistent performance.
Monitoring Strategy
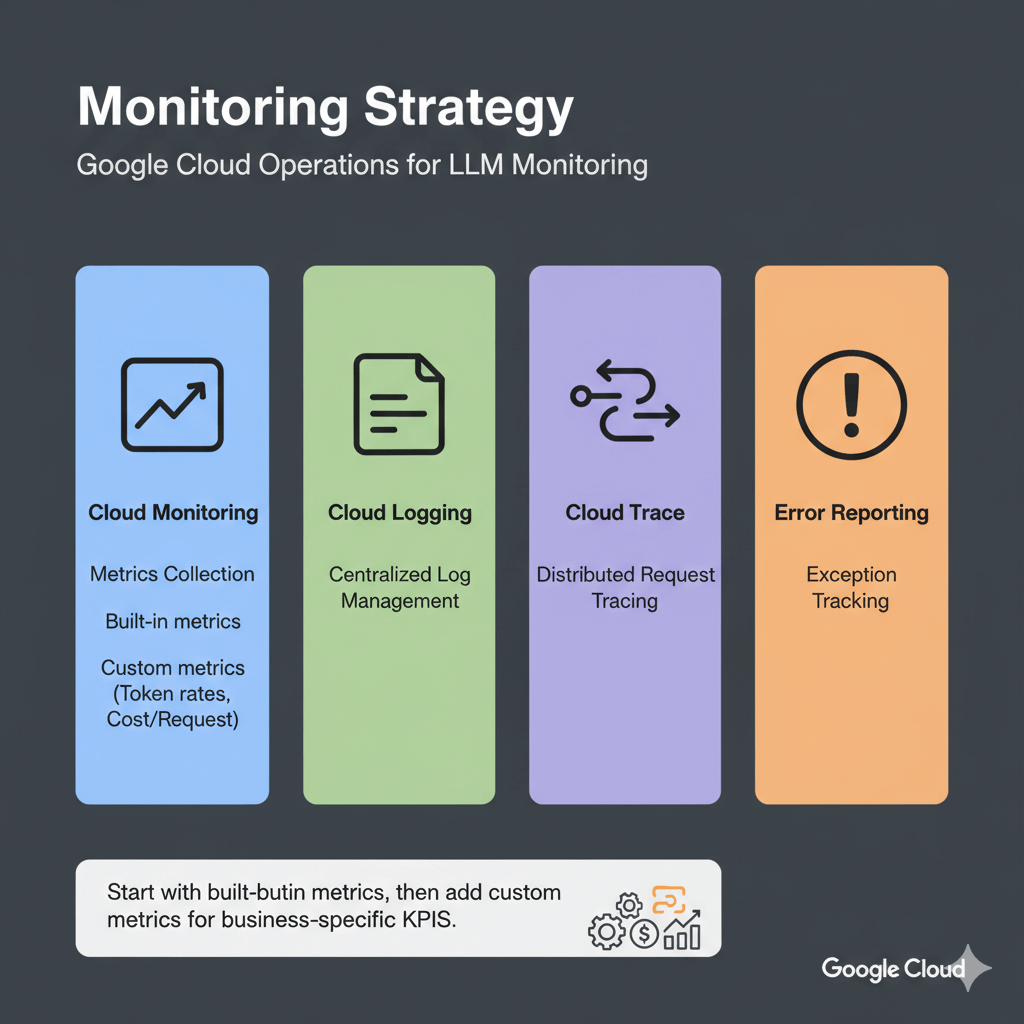
Google Cloud Operations provides four core capabilities for LLM monitoring: Cloud Monitoring for metrics collection, Cloud Logging for centralized log management, Cloud Trace for distributed request tracing, and Error Reporting for exception tracking.
Start with built-in metrics from managed services, then add custom metrics for business-specific KPIs like token generation rates and cost per request.
Essential Metrics and Alerting
Track these metrics for healthy LLM deployments across Vertex AI, GKE, and Cloud Run.
Vertex AI Endpoint Metrics
Vertex AI automatically collects prediction count, latencies (P50, P95, P99), error rates, CPU/memory utilization, and replica counts. Query these metrics using the Cloud Monitoring API or view in Console dashboards.
Custom Application Metrics
Track business-specific metrics:
from google.cloud import monitoring_v3
import time

def write_custom_metric(metric_value, metric_type="tokens_generated"):
    client = monitoring_v3.MetricServiceClient()
    ...
Alerting Policies
Automated alerts prevent outages. Configure alerts for high latency, error rates, and resource exhaustion.
High Latency Alert:
alert_policy = monitoring_v3.AlertPolicy()
alert_policy.display_name = "LLM High Latency Alert"
# ... configure conditions
Error Rate Alert:
error_alert = monitoring_v3.AlertPolicy()
error_alert.display_name = "LLM High Error Rate"
# ... configure threshold at 5%
Log Analysis and Debugging
Centralized logging with Cloud Logging enables rapid troubleshooting and audit trails.
Structured Logging
import logging
import google.cloud.logging

logging_client = google.cloud.logging.Client()
logging_client.setup_logging()
Log Queries
Query logs to find slow requests, errors, or specific patterns using Cloud Logging filters. Filter by resource type, payload fields, timestamp ranges, and severity levels to debug issues quickly.
Create Custom Dashboard
Visualize metrics for quick insights with custom dashboards.
Cost Tracking and Optimization
Monitor spending on ML infrastructure to control cloud costs.
Query Billing Data
from google.cloud import bigquery

client = bigquery.Client()
results = client.query("SELECT service, SUM(cost) FROM billing_export GROUP BY service")
Budget Alerts
budget.threshold_rules = [
    ThresholdRule(threshold_percent=0.5),
    ThresholdRule(threshold_percent=0.9),
    ThresholdRule(threshold_percent=1.0)
]
Performance and Reliability Tracking
Track requests across services, monitor SLOs, and identify performance bottlenecks.
Distributed Tracing with Cloud Trace
tracer = trace.get_tracer(__name__)
with tracer.start_as_current_span("llm_inference") as span:
    span.set_attribute("model", "llama-70b")
    output = model.generate(request.prompt)
Service Level Objectives
Track service level objectives to maintain reliability.
Performance Profiling
Identify bottlenecks with Cloud Profiler. Enable profiling to track CPU hotspots, memory allocations, and heap usage.
Typical LLM bottlenecks include model loading (10-30% CPU time), tokenization (5-15% CPU), inference (70-80% GPU), and post-processing (2-5% CPU).
import googlecloudprofiler
googlecloudprofiler.start(service="llm-inference", service_version="1.0.0")
Conclusion
Effective monitoring transforms LLM deployments from fragile experiments into reliable production systems. Google Cloud Operations provides the observability foundation needed to maintain high availability and performance.
Start with built-in metrics from Vertex AI, GKE, or Cloud Run, then enhance monitoring with custom application metrics that track business-specific KPIs like token costs and user satisfaction.
Implement the three-tier alerting strategy: critical alerts for immediate response, warning alerts for proactive investigation, and informational alerts for trend analysis.
This balanced approach prevents alert fatigue while catching issues before they impact users. Cost tracking is equally important.
Use BigQuery billing exports to analyze spending patterns, set budget alerts at 50%, 90%, and 100% thresholds, and optimize by right-sizing instances based on actual utilization data.
For the complete GCP LLM deployment strategy, including Vertex AI, GKE, Cloud Run, and TPU optimization, see our GCP LLM deployment guide.
Frequently Asked Questions
How much does Cloud Monitoring cost for production LLM deployments?
Cloud Monitoring offers generous free tiers: 150 MB/month metrics, 50 GB/month logs, and basic alerting.
Typical production costs: ~$57/month for moderate traffic, $200-300/month for high-traffic deployments.
Optimize by sampling logs (10% successful, 100% errors), aggregating metrics, and using 30-day retention.
What's the best alerting strategy for LLM production deployments?
Implement three-tier alerting: Critical (page immediately): endpoint down >2 minutes, error rate >5%, P95 latency >2000ms.
Warning (Slack/email): error rate 2-5%, P95 latency 1.5-2x SLA, GPU >90%.
Info (daily digest): volume trends, cost patterns.
Start critical-only for 2 weeks, establish baselines, then add warnings at 1.5x baseline.
Can I export GCP metrics to third-party monitoring tools?
Yes.
Prometheus: deploy Metrics Exporter.
Datadog: native GCP integration.
New Relic: GCP integration every 5 minutes.
Grafana Cloud: Cloud Monitoring data source with PromQL.
Custom tools: query via Monitoring API or stream logs to Pub/Sub for Elasticsearch, Splunk, or custom pipelines.
Summarize this post with:
Ready to put this into production?
Our engineers have deployed these architectures across 100+ client engagements — from AWS migrations to Kubernetes clusters to AI infrastructure. We turn complex cloud challenges into measurable outcomes.